


Next 24 hours: Yen outperforms on BOJ rate hike speculation
Today’s report: Commodity FX gets no help from higher US equities
Markets were all over the place on Monday. US equities put in a decent recovery, though this did nothing to help beaten down commodity FX, with the Australian Dollar, New Zealand Dollar and Canadian Dollar all getting hammered.
Wake-up call
- consumer confidence
- new government
- BOJ officials
- AUDUSD Commodities slide punishing Australian Dollar
- Canadians anxious
- trade data
- Fed outlook
- Macro themes
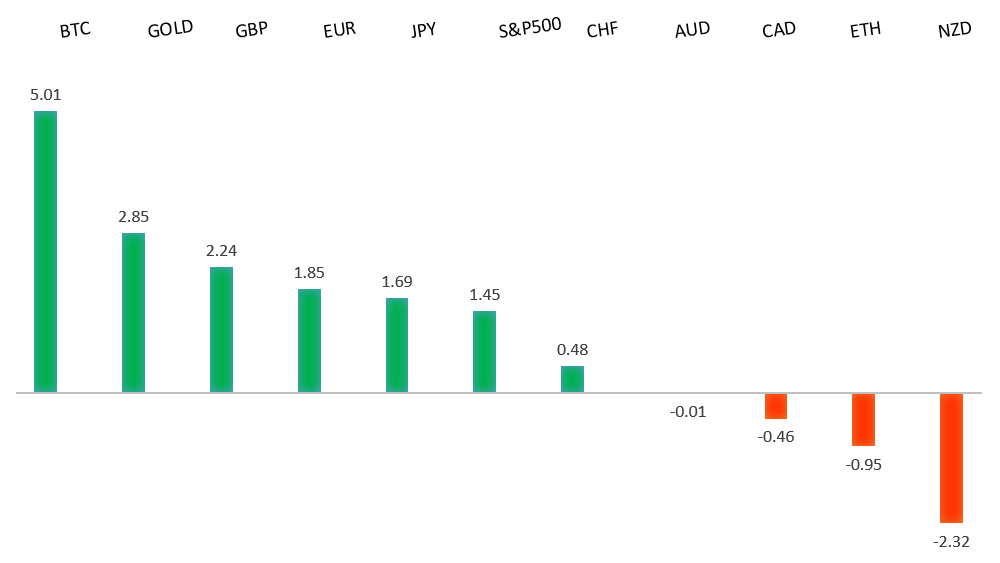
Peformance chart: 30-Day Performance vs. US dollar (%)
Suggested reading
- What If We're Incorrect, That The Rally's Just Starting?, S. McBride, RiskHedge (July 15, 2024)
- The Folly of Certainty, H. Marks, Oaktree Capital (July 17, 2024)
Chart talk: Technical & fundamental highlights
Choose pair:
EURUSD – technical overview
The Euro has been in a multi-month consolidation since bottoming out in 2022. Setbacks have since been exceptionally well supported on dips below 1.0500, with a higher platform sought out ahead of the next major upside extension. Look for a push through the 2023 high at 1.1276 to strengthen the constructive outlook and extend the recovery run towards 1.2000. Only back below 1.0400 negates.EURUSD – fundamental overview
The Euro held steady on Monday in an exceptionally thin calendar day. Key standouts on Tuesday’s calendar come from Eurozone consumer confidence, US existing home sales, and Richmond Fed manufacturing.EURUSD - Technical charts in detail
GBPUSD – technical overview
Signs have emerged of the market wanting to put in a longer-term base after collapsing to a record low in September 2022. The door is now open for the next major upside extension towards the 2023 high at 1.3143. Any setbacks should be well supported ahead of 1.2500.GBPUSD – fundamental overview
The Pound may be struggling a little with some questions around confidence in the new government. The BOE is set to cast doubt on the government's rosy economic targets, while there has also been worry around an underbudgeting of raises for teachers and healthcare workers. Key standouts on Tuesday’s calendar come from Eurozone consumer confidence, US existing home sales, and Richmond Fed manufacturing.USDJPY – technical overview
The market remains confined to a strong uptrend, most recently extending to a multi-year high through 160.00. Key support comes in at 151.95, with only a weekly close below to delay the constructive outlook. Next major resistance comes in at 165.00.USDJPY – fundamental overview
Odds for a BOJ rate hike at the end of the month stand at about 50% as officials battle over worry around weak spending and the need for more data, versus risks of missing a window of opportunity for a rate hike. Key standouts on Tuesday’s calendar come from Eurozone consumer confidence, US existing home sales, and Richmond Fed manufacturing.AUDUSD – technical overview
There are signs of the potential formation of a longer-term base with the market trading down into a meaningful longer-term support zone. Only a monthly close below 0.6200 would give reason for rethink. Back above 0.6900 will take the big picture pressure off the downside and strengthen case for a bottom.AUDUSD – fundamental overview
The China rate cut did very little to inspire any demand for the Australian Dollar, which has since come under intense pressure as commodities prices slide. Key standouts on Tuesday’s calendar come from Eurozone consumer confidence, US existing home sales, and Richmond Fed manufacturing.USDCAD – technical overview
Above 1.3000 signals an end to a period of longer-term bearish consolidation and suggests the market is in the process of carving out a more significant longer-term base. Next key resistance now comes in up into the 1.4000 area. Setbacks should be very well supported down into the 1.3000 area.USDCAD – fundamental overview
The latest Bank of Canada survey has revealed a sharp rise in anxiety over taxes and regulation. Meanwhile, lower commodities prices are also weighing on the correlated Canadian Dollar. Odds for a Wednesday rate cut from the Bank of Canada sit at greater than 90%. Key standouts on Tuesday’s calendar come from Eurozone consumer confidence, US existing home sales, and Richmond Fed manufacturing.NZDUSD – technical overview
Overall pressure remains on the downside with the market continuing to stall out on runs up into the 0.6500 area. At the same time, there are some signs of the market wanting to put in a longer-term base. Ultimately, a break back above 0.6500 would be required to take the medium-term pressure off the downside and encourage this prospect. A monthly close below 0.5800 will intensify bearish price action.NZDUSD – fundamental overview
On the surface, New Zealand trade data produced a solid headline reading. However, at closer glance, the underlying components were distressing, with both imports and exports declining outright. This along with an ongoing slide in commodities prices proved to be a big weight on the New Zealand Dollar. Key standouts on Tuesday’s calendar come from Eurozone consumer confidence, US existing home sales, and Richmond Fed manufacturing.US SPX 500 – technical overview
Longer-term technical studies continue to look quite extended, begging for a deeper correction ahead. The latest rally has extended to reach and even exceed a 355 point measured move extension target objective in the 5,640 area, adding to the case for an imminent correction. At this stage, additional upside should be limited to allow for overbought studies to unwind. There is now room for a pullback towards previous resistance turned support in the form of the previous record high from April around 5,290.US SPX 500 – fundamental overview
Though we have seen a healthy adjustment of investor expectations towards the amount of rate cuts in 2024, the market still hopes policy will end up erring more towards the investor friendly, accommodative side of things. This bet has kept stocks well bid into dips and consistently pushing record highs. Still, if there is a sense the Fed will need to be more sensitive towards erring on the side of higher rates, it could invite major disruption to the stock market.GOLD (SPOT) – technical overview
The 2019 breakout above the 2016 high at 1375 was a significant development, opening the door for fresh record highs and this next major upside extension into the 2500-3000 area. Setbacks should now be well supported above 2200 on a monthly close basis.GOLD (SPOT) – fundamental overview
The yellow metal has pushed record highs in 2024 with solid demand from medium and longer-term accounts. These players are more concerned about inflation, geopolitical risk and a less upbeat global growth outlook. All of this should keep the commodity well supported, with many market participants also fleeing to the hard asset as the grand dichotomy of record high equities and record low yields comes to an end.