


Next 24 hours: Stocks can't ignore movement into US Dollar
Today’s report: Do you trust stocks or currencies?
We’re getting mixed messages as we come into this new week of trade. On the one side, US equities have been strong, rallying back to their highest levels in over a month.
Wake-up call
- hot inflation
- honeymoon phase
- negative rate
- Aussie PPI
- GDP beat
- RMB weakness
- Inflation headache
- Dealers report
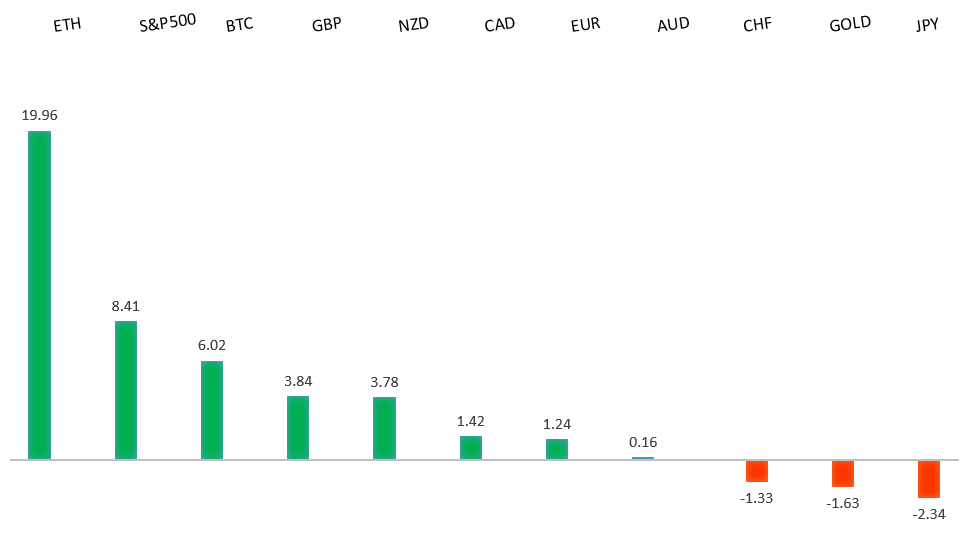
Peformance chart: 30 Day Performance vs. US dollar (%)
Suggested reading
- Why Earnings Don’t Scare Stocks This Halloween, J. Authers, Bloomberg (October 31, 2022)
- Can Superhot Rock Energy Be Delivered at Scale?, M. McCormick, FT (October 31, 2022)
Chart talk: Technical & fundamental highlights
Choose pair:
EURUSD – technical overview
Technical studies are turning up from oversold territory, suggesting additional setbacks should be limited in favour of some form of a meaningful correction and consolidation. A weekly close back above parity will take the immediate pressure off the downside.EURUSD – fundamental overview
The Euro has been trading with a heavier tone since last week's dovish ECB communication. Making matters even more complicated has been a subsequent round of hotter than expected inflation data. Key standouts on today’s calendar come from German retail sales, Eurozone inflation, Eurozone GDP, US Chicago PMIs, and Dallas Fed manufacturing.EURUSD - Technical charts in detail
GBPUSD – technical overview
Signs have emerged of the market wanting to put in a longer-term base after collapsing to a record low in September. A break above the September high at 1.1739 will solidify the recovery. Until then, look for setbacks to be well supported ahead of 1.0800.GBPUSD – fundamental overview
The Pound has been holding up well on a relative basis, still benefiting from a PM Sunak honeymoon period. The market is pricing a 75 basis point rate hike from the BOE later this week. Key standouts on today’s calendar come from German retail sales, Eurozone inflation, Eurozone GDP, US Chicago PMIs, and Dallas Fed manufacturing.USDJPY – technical overview
Technical studies are looking quite stretched on the longer-term chart, warning of consolidation and correction in the days and weeks ahead. Look for additional upside from here to be well capped on rallies above 150.00. Next key support comes in at 145.43.USDJPY – fundamental overview
The Yen has remained under pressure as the BOJ maintains its negative rate stance, while increasing JGB purchases. All of this comes at a time when inflation is surging. Japan believes it can counter inflation by way of a $200 billion stimulus plan. Key standouts on today’s calendar come from German retail sales, Eurozone inflation, Eurozone GDP, US Chicago PMIs, and Dallas Fed manufacturing.AUDUSD – technical overview
Overall pressure remains on the downside with the market confined to a well defined downtrend. A break back above 0.6682 would be required to take the pressure off the downside. Until then, scope exists for deeper setbacks towards 0.6000.AUDUSD – fundamental overview
The latest breakdown in Chinese and metals markets has weighed on the Australian Dollar. Iron ore is down more than 15% on the month, and the RMB continues to slide. Making matters more complicated is the record pace of this latest Aussie producer prices data. Key standouts on today’s calendar come from German retail sales, Eurozone inflation, Eurozone GDP, US Chicago PMIs, and Dallas Fed manufacturing.USDCAD – technical overview
A recent surge back above 1.3000 signals an end to a period of bearish consolidation and suggests the market is in the process of carving out a more significant longer-term base. Next key resistance now comes in up into the 1.4000 area. Setbacks should be very well supported down into the 1.3000 area.USDCAD – fundamental overview
The Canadian Dollar managed to outperform its peer group at the end of last week, getting help from the better than expected Canada GDP beat. Key standouts on today’s calendar come from German retail sales, Eurozone inflation, Eurozone GDP, US Chicago PMIs, and Dallas Fed manufacturing.NZDUSD – technical overview
Overall pressure remains on the downside with the focus on a retest of the critical low from 2020 at 0.5469. A break back above 0.6162 would be required to take the immediate pressure off the downside.NZDUSD – fundamental overview
The New Zealand Dollar got some help from a hawkish shift in RBNZ Orr sentiment last week. At the same time, fallout in China and commodities prices, along with ongoing weakness in the RMB and Yen, were enough to invite offers into this latest rally. Key standouts on today’s calendar come from German retail sales, Eurozone inflation, Eurozone GDP, US Chicago PMIs, and Dallas Fed manufacturing.US SPX 500 – technical overview
Longer-term technical studies are in the process of unwinding from extended readings off record highs. Look for rallies to be well capped in favor of lower tops and lower lows. Back above 4000 will be required at a minimum to take the immediate pressure off the downside. Next major support comes in around 3200.US SPX 500 – fundamental overview
We've finally reached a point in the cycle where the Fed recognizes unanchored inflation expectations pose a greater downside risk than over-tightening. This is significant, as it means less investor friendly monetary policy that risks potential recession in the months ahead. Overall, we expect inflation to continue to be a problem in 2022 that results in downside pressure into rallies.GOLD (SPOT) – technical overview
The 2019 breakout above the 2016 high at 1375 was a significant development, opening the door for fresh record highs. Setbacks should now be well supported above 1600 on a monthly close basis ahead of the next major upside extension.GOLD (SPOT) – fundamental overview
The yellow metal continues to be well supported on dips with solid demand from medium and longer-term accounts. These players are more concerned about inflation risk and a less upbeat global growth outlook. All of this should keep the commodity well supported, with many market participants also fleeing to the hard asset as the grand dichotomy of record high equities and record low yields comes to an unnerving climax.