


Today’s report: Where things stand into Friday
We’ve just come out of two major central bank meetings within the past 24 hours. The ECB delivered a 75-basis point rate hike as widely expected on Thursday, but surprised the market with a more dovish communication.
Wake-up call
- dovish ECB
- hike expectations
- BOJ decision
- partial lockdown
- Analyst critical
- Hawkish Orr
- Inflation headache
- Dealers report
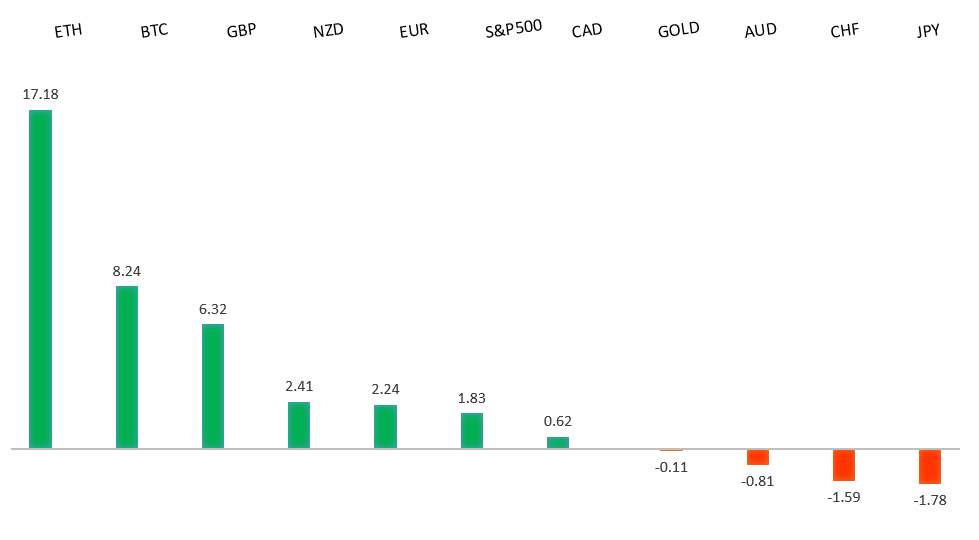
Peformance chart: 30 Day Performance vs. US dollar (%)
Suggested reading
- An Investor's Guide to the Looming Debt-Ceiling Fight, A. Brown, Bloomberg (October 27, 2022)
- Can scientists develop a coffee bean more resistant to climate change?, N. Fildes, FT (October 26, 2022)
Chart talk: Technical & fundamental highlights
Choose pair:
EURUSD – technical overview
Technical studies are turning up from oversold territory, suggesting additional setbacks should be limited in favour of some form of a meaningful correction and consolidation. A weekly close back above parity will take the immediate pressure off the downside.EURUSD – fundamental overview
The Euro sold off in the aftermath of a dovish ECB rate hike decision. The central bank said substantial progress had been made in removing accommodation, while dropping the reference to rates increasing for several meetings. Key standouts on Friday’s calendar come from German GDP, German inflation reads, Eurozone sentiment and confidence indicators, US personal income and spending, US core PCE, US pending home sales, and US Michigan sentiment.EURUSD - Technical charts in detail
GBPUSD – technical overview
Signs have emerged of the market wanting to put in a longer-term base after collapsing to a record low in September. A break above the September high at 1.1739 will solidify the recovery. Until then, look for setbacks to be well supported ahead of 1.0800.GBPUSD – fundamental overview
The Pound has come under pressure into Friday on the back of a renewed round of US Dollar demand and risk off flow. At the same time, the Pound has held up better than many of its peers on account of an improvement in UK CBI sales data. We have however seen a little scaling back with respect to expectations around next week's BOE policy decision in light of recent more dovish communications from other central banks. Key standouts on Friday’s calendar come from German GDP, German inflation reads, Eurozone sentiment and confidence indicators, US personal income and spending, US core PCE, US pending home sales, and US Michigan sentiment.USDJPY – technical overview
Technical studies are looking quite stretched on the longer-term chart, warning of consolidation and correction in the days and weeks ahead. Look for additional upside from here to be well capped on rallies above 150.00. Next key support comes in at 145.43.USDJPY – fundamental overview
Earlier today, the Bank of Japan came out leaving monetary policy settings unchanged as widely expected. However, the BOJ did note wages and prices could rise more than expected even if an assumption that they will not increase easily was “deeply entrenched”. This may be responsible for some Yen demand on Friday, though most of what we've been seeing is a Yen that has rallied back this week, getting help from Japan intervention efforts and a wave of broad based US Dollar selling. Overall however, monetary policy divergence should continue to welcome renewed Yen selling into rallies. Key standouts on Friday’s calendar come from German GDP, German inflation reads, Eurozone sentiment and confidence indicators, US personal income and spending, US core PCE, US pending home sales, and US Michigan sentiment.AUDUSD – technical overview
Overall pressure remains on the downside with the market confined to a well defined downtrend. A break back above 0.6682 would be required to take the pressure off the downside. Until then, scope exists for deeper setbacks towards 0.6000.AUDUSD – fundamental overview
The Australian Dollar has been hit on renewed US Dollar demand, risk off flow, more weakness in the Yuan, and sinking iron ore prices. China can't seem to get away from COVID as Wuhan goes into a partial lockdown. Key standouts on Friday’s calendar come from German GDP, German inflation reads, Eurozone sentiment and confidence indicators, US personal income and spending, US core PCE, US pending home sales, and US Michigan sentiment.USDCAD – technical overview
A recent surge back above 1.3000 signals an end to a period of bearish consolidation and suggests the market is in the process of carving out a more significant longer-term base. Next key resistance now comes in up into the 1.4000 area. Setbacks should be very well supported down into the 1.3000 area.USDCAD – fundamental overview
A BMO analyst has been critical of the latest Bank of Canada policy decision in which he says the central bank was mistaken in only opting for a 50 basis point rate hike. There is a deep concern the central bank will now fall behind the inflation curve. Key standouts on Friday’s calendar come from German GDP, German inflation reads, Eurozone sentiment and confidence indicators, US personal income and spending, US core PCE, US pending home sales, and US Michigan sentiment.NZDUSD – technical overview
Overall pressure remains on the downside with the focus on a retest of the critical low from 2020 at 0.5469. A break back above 0.6162 would be required to take the immediate pressure off the downside.NZDUSD – fundamental overview
No surprise to see the New Zealand Dollar outperforming into Friday. RBNZ Orr was on the wires the other day talking decidedly more hawkish, saying rate hikes would continue even if it meant jobs being lost. Key standouts on Friday’s calendar come from German GDP, German inflation reads, Eurozone sentiment and confidence indicators, US personal income and spending, US core PCE, US pending home sales, and US Michigan sentiment.US SPX 500 – technical overview
Longer-term technical studies are in the process of unwinding from extended readings off record highs. Look for rallies to be well capped in favor of lower tops and lower lows. Back above 4000 will be required at a minimum to take the immediate pressure off the downside. Next major support comes in around 3200.US SPX 500 – fundamental overview
We've finally reached a point in the cycle where the Fed recognizes unanchored inflation expectations pose a greater downside risk than over-tightening. This is significant, as it means less investor friendly monetary policy that risks potential recession in the months ahead. Overall, we expect inflation to continue to be a problem in 2022 that results in downside pressure into rallies.GOLD (SPOT) – technical overview
The 2019 breakout above the 2016 high at 1375 was a significant development, opening the door for fresh record highs. Setbacks should now be well supported above 1600 on a monthly close basis ahead of the next major upside extension.GOLD (SPOT) – fundamental overview
The yellow metal continues to be well supported on dips with solid demand from medium and longer-term accounts. These players are more concerned about inflation risk and a less upbeat global growth outlook. All of this should keep the commodity well supported, with many market participants also fleeing to the hard asset as the grand dichotomy of record high equities and record low yields comes to an unnerving climax.