


 | ||
| 4th May 2026 | view in browser | ||
| Oil, Iran, and rates: the trifecta steering global markets | ||
| Markets are consolidating in a cautious tone as Middle East tensions drive oil-linked inflation risks, keeping the US Dollar supported and central bank expectations tilted hawkish while limiting conviction across risk assets. | ||
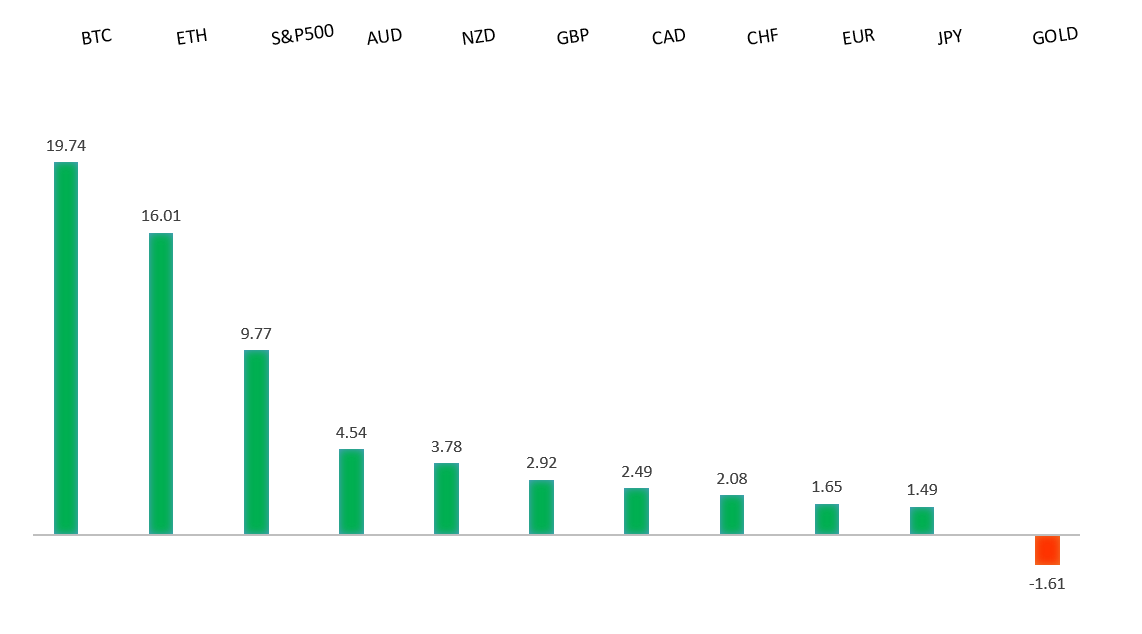
| Performance chart 30day v. USD (%) | ||
 | ||
| Technical & fundamental highlights | ||
| EURUSD: technical overview | ||
| The Euro outlook remains constructive with higher lows sought out on dips in favor of the next major upside extension targeting the 2021 high at 1.2350. Setbacks should be exceptionally well supported ahead of 1.1300. | ||
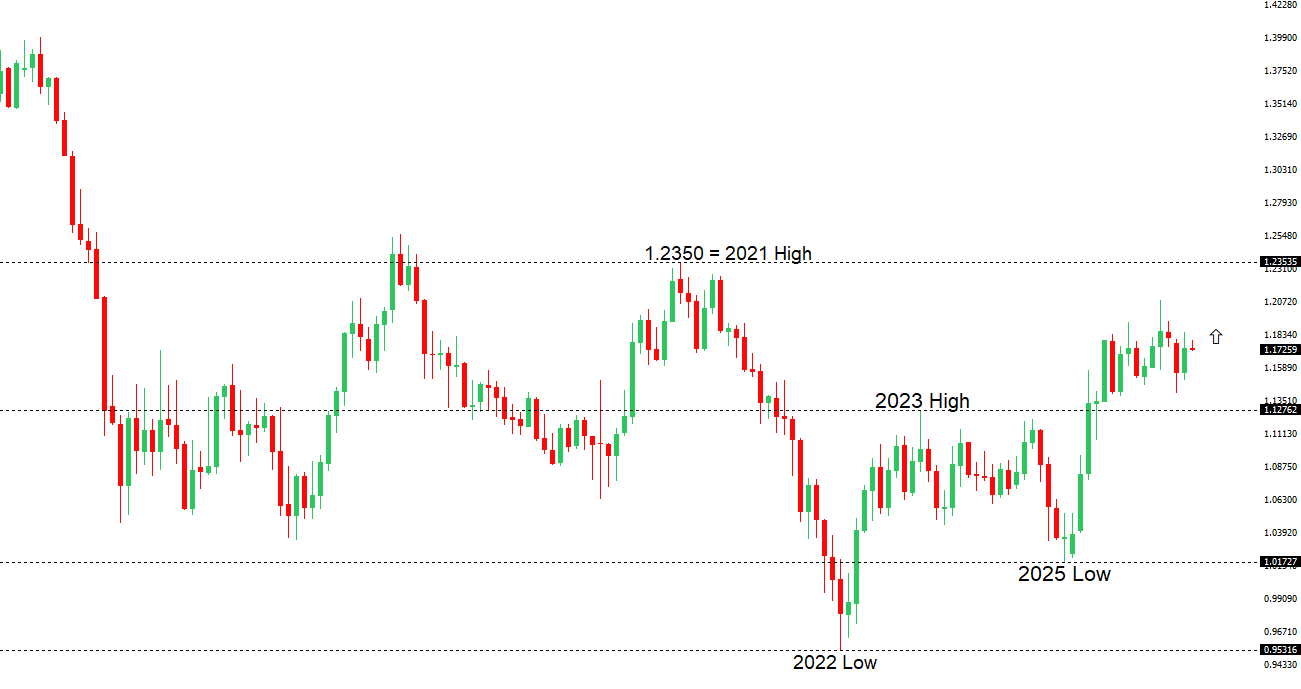 | ||
| R2 1.1850 - 17 April high - Strong R1 1.1786 - 1 May high - Medium S1 1.1650 - 9 April low - Medium S2 1.1589 - 8 April low - Strong | ||
| EURUSD: fundamental overview | ||
| The Euro is currently trading on the back foot, weighed down by a combination of rising trade tensions and a firmer US Dollar backdrop. Fresh downside pressure has emerged after US President Donald Trump signaled plans to raise tariffs on EU cars and trucks to 25%, a move that risks escalating a transatlantic trade dispute and undermining the export-sensitive Eurozone outlook. The European Commission has pushed back, vowing to defend its position, but the threat of retaliation is adding uncertainty to growth prospects. At the same time, broader geopolitical risks—particularly escalating tensions around Iran and the Strait of Hormuz—are driving safe-haven demand for the US Dollar, further weighing on EURUSD. This comes on top of an already fragile macro backdrop in the Eurozone, where growth remains subdued and the policy stance of the European Central Bank is seen as relatively cautious compared to a still-resilient US economy. Taken together, the Euro is being pulled lower by a mix of external shocks (trade and geopolitics), relative policy divergence, and ongoing concerns about the region’s growth momentum, keeping rallies shallow and sentiment defensive. | ||
| USDJPY: technical overview | ||
| There are signs of the formation of a meaningful top after the market put in a multi-year high in 2024. At this point, rallies should be well capped above 160.00 in favor of a fresh down-leg back towards the 2024 low at 139.58. Only a monthly close above 160.00 negates. | ||
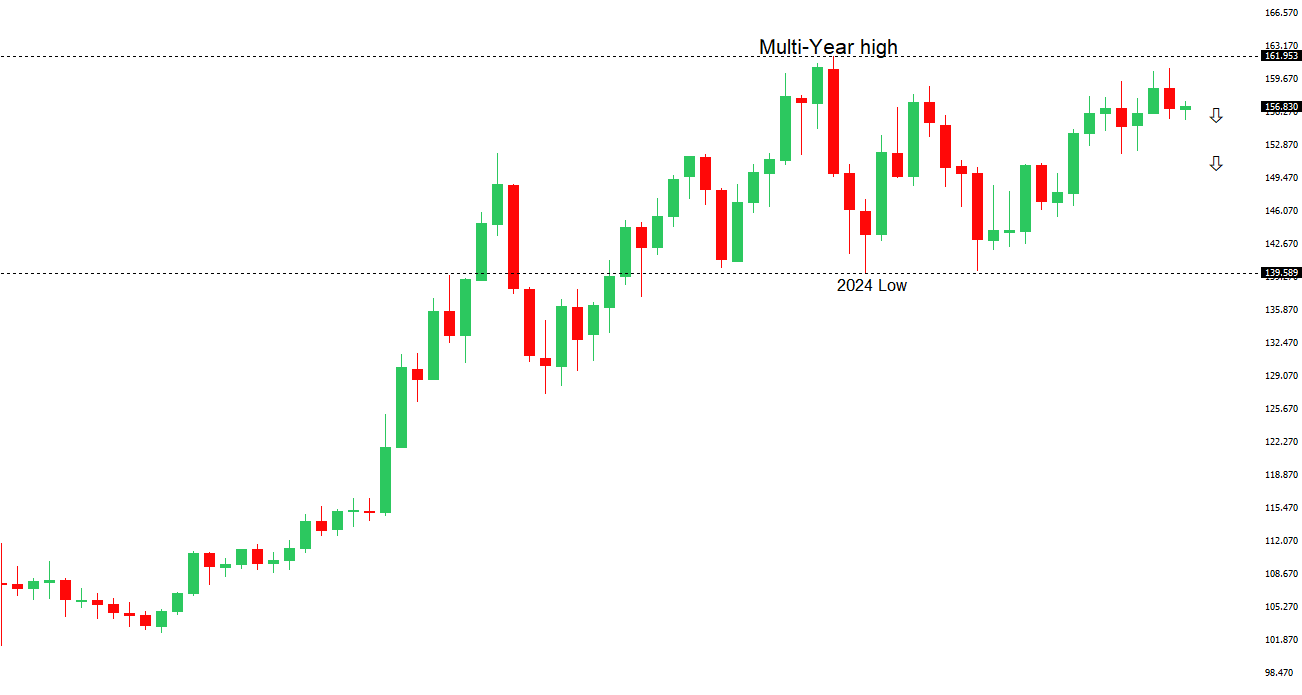 | ||
| R2 159.53 - 17 April low - Medium R1 157.33 - 1 May high - Medium S1 156.00 - Figure - Medium S2 155.49 - 1 May low - Strong | ||
| USDJPY: fundamental overview | ||
| The Japanese Yen remains fundamentally pressured by the wide policy divergence between a still-hawkish Federal Reserve and an ultra-accommodative Bank of Japan, though near-term price action is being shaped by a more complex mix of geopolitical risk and policy intervention. On one hand, escalating tensions around Iran and the Strait of Hormuz—alongside rising US rate hike expectations flagged by officials like Neel Kashkari—are supporting the US Dollar via higher yields and safe-haven demand, keeping USDJPY elevated near the mid-150s. On the other hand, the Yen is finding intermittent support from suspected Japanese government intervention, with reports suggesting authorities spent heavily in early May to stabilize the currency, reinforcing a de facto ceiling on USDJPY rallies. This leaves the Yen caught between structurally bearish fundamentals—persistent yield differentials, imported inflation pressures, and cautious BoJ normalization—and episodic support from both safe-haven flows during risk spikes and direct intervention risk, resulting in a choppy consolidation rather than a sustained directional move. | ||
| AUDUSD: technical overview | ||
| There are signs of the formation of a longer-term base with the market recovering out from a meaningful longer-term support zone. The latest monthly close back above 0.7000 takes the big picture pressure off the downside and strengthens the case for a bottom, with the focus now on a push towards 0.8000. Setbacks should now be well supported ahead of 0.6700. | ||
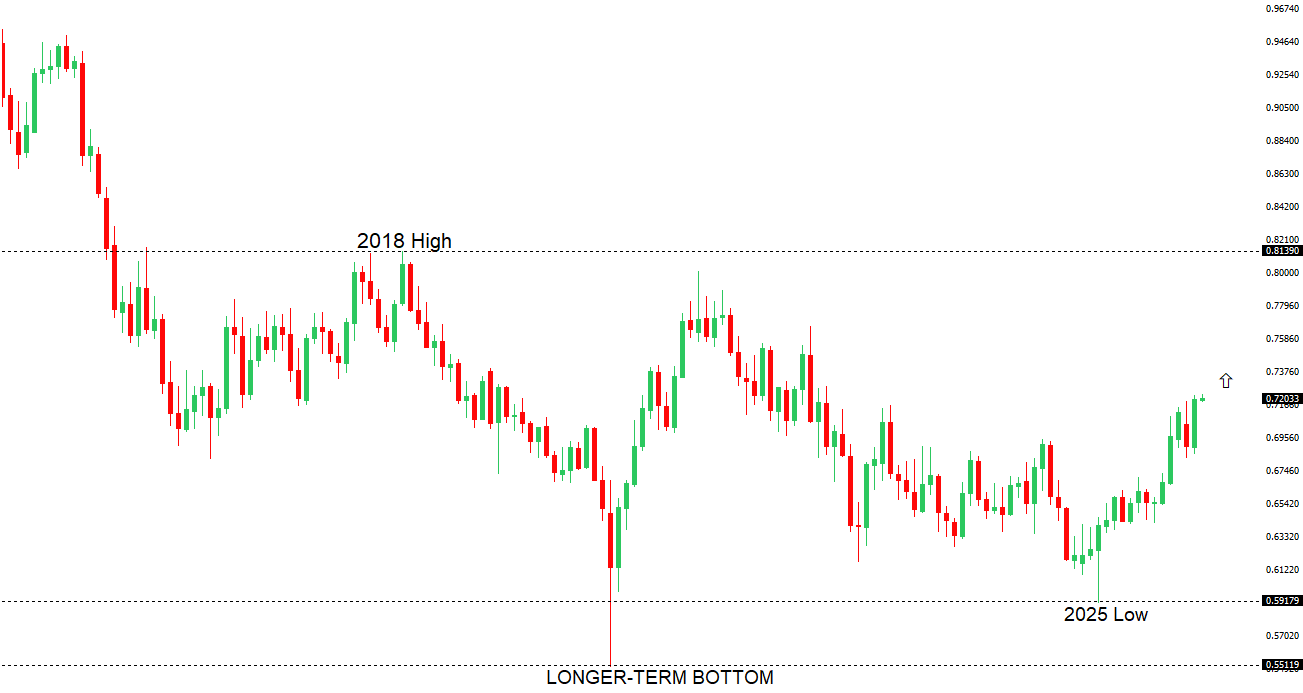 | ||
| R2 0.7300 - Figure - Medium R1 0.7228 - 1 May/2026 high - Medium S1 0.7101 - 30 April low - Medium S2 0.6963 - 8 April low - Strong | ||
| AUDUSD: fundamental overview | ||
| The Australian Dollar has been supported primarily by a still-firm domestic inflation backdrop and building expectations that the Reserve Bank of Australia will deliver another rate hike at its May meeting (tomorrow), with markets pricing a high probability of a move to around 4.35%. Recent data reinforce this narrative, with the Melbourne Institute gauge showing inflation continuing to rise, underscoring persistent price pressures despite some moderation in momentum. At the same time, the policy outlook is increasingly nuanced: while a tight labor market and rising inflation expectations—exacerbated by higher global energy prices linked to escalating US-Iran tensions—argue for further tightening, softer activity indicators (notably a sharp drop in building approvals and ongoing declines in job ads) point to emerging cracks in domestic demand. Indeed, the external backdrop has become a double-edged sword for the currency—elevated commodity and energy prices are inflationary and support the hawkish RBA narrative, but geopolitical risk is simultaneously boosting safe-haven demand for the US Dollar, capping AUD upside. As highlighted by one major Australian bank, the upcoming decision is effectively “line ball,” with the central bank balancing above-target inflation and cost pass-through from the Iran conflict against weakening sentiment, a slowing growth outlook, and early signs of housing market stress, leaving the AUD trading in a supported but cautious bullish consolidation phase. | ||
| Suggested reading | ||
| How robotaxis will reshape the ride-hailing market, R. Rosner-Uddin, Financial Times (May 1, 2026) When Warsh Takes Over, He Must Turn the Fed Upside Down, S. Forbes, Forbes (April 30, 2026) | ||