


 | ||
| 5th May 2026 | view in browser | ||
| RBA hikes, but macro reality caps Aussie | ||
| Markets are trading cautiously with the US Dollar supported and risk sentiment fragile as Middle East tensions and elevated oil prices reinforce inflation risks and a higher-for-longer central bank backdrop. | ||
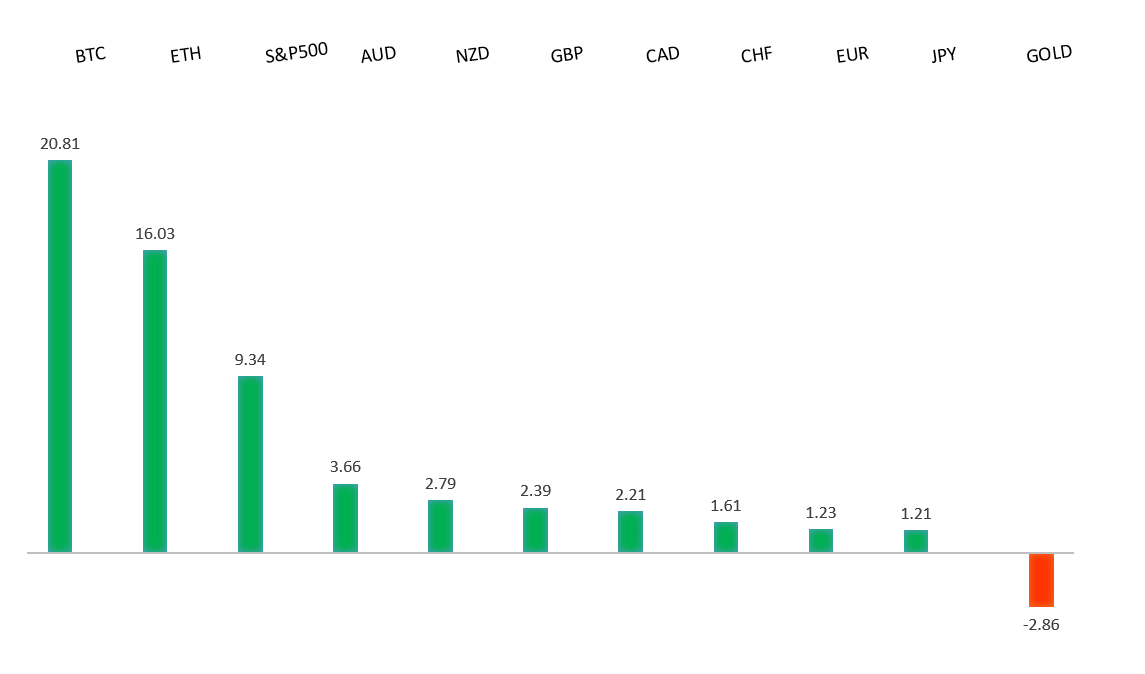
| Performance chart 30day v. USD (%) | ||
 | ||
| Technical & fundamental highlights | ||
| EURUSD: technical overview | ||
| The Euro outlook remains constructive with higher lows sought out on dips in favor of the next major upside extension targeting the 2021 high at 1.2350. Setbacks should be exceptionally well supported ahead of 1.1300. | ||
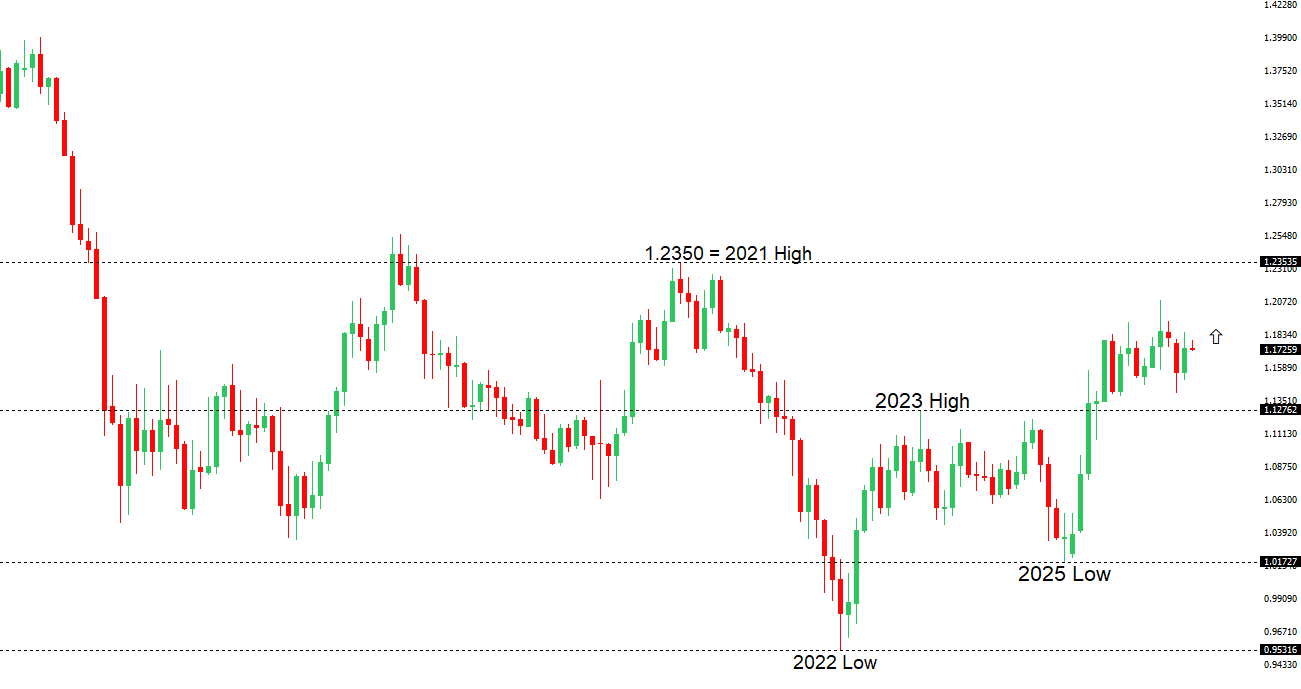 | ||
| R2 1.1850 - 17 April high - Strong R1 1.1786 - 1 May high - Medium S1 1.1650 - 9 April low - Medium S2 1.1589 - 8 April low - Strong | ||
| EURUSD: fundamental overview | ||
| The euro is trading with a softer bias, primarily driven by external dynamics rather than a material shift in the domestic policy outlook, with escalating Middle East tensions—most notably the Iran-UAE escalation—fueling safe-haven demand for the US Dollar and weighing on EURUSD. The geopolitical backdrop is reinforcing a stronger USD via both risk aversion and higher oil-linked inflation expectations, which in turn supports a more hawkish stance from the Federal Reserve. Against this, the European Central Bank is maintaining a cautiously hawkish tone, with policymakers such as ECB Nagel signaling that further tightening as soon as June remains possible if inflation does not improve, helping to put a floor under the Euro. However, this support is being offset by a more fragile macro backdrop in the Eurozone, where growth risks are rising and the ECB itself acknowledges a worsening balance between upside inflation risks and downside activity risks. As a result, the euro is being pulled in two directions—supported by residual hawkish policy expectations but ultimately pressured by global risk dynamics and relative policy divergence—leaving it vulnerable to further downside as long as geopolitical tensions continue to underpin the Dollar. | ||
| USDJPY: technical overview | ||
| There are signs of the formation of a meaningful top after the market put in a multi-year high in 2024. At this point, rallies should be well capped above 160.00 in favor of a fresh down-leg back towards the 2024 low at 139.58. Only a monthly close above 160.00 negates. | ||
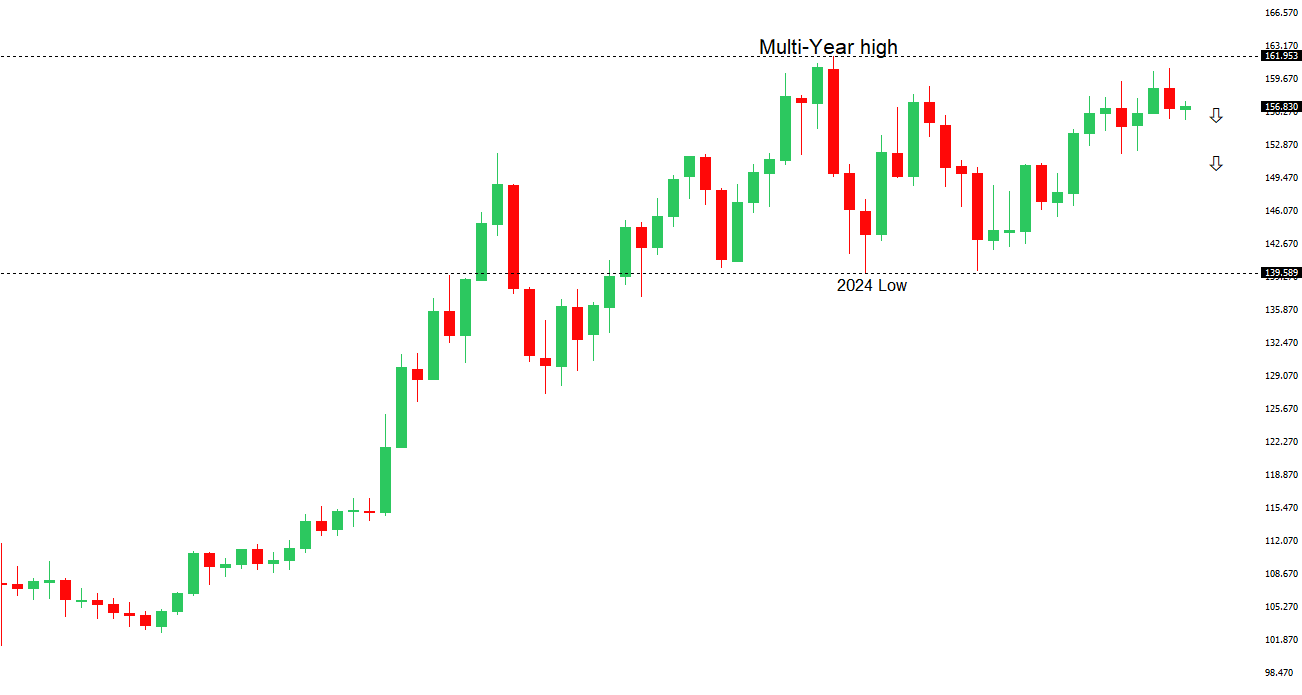 | ||
| R2 159.53 - 17 April low - Medium R1 157.59 - 17 April low - Medium S1 156.00 - Figure - Medium S2 155.49 - 1 May low - Strong | ||
| USDJPY: fundamental overview | ||
| The yen remains fundamentally pressured in the near term, caught between entrenched carry dynamics and an increasingly complex macro backdrop, even as longer-term constructive narratives persist. The currency continues to underperform as a preferred funding vehicle, with wide yield differentials versus the US—anchored by a still-hawkish Federal Reserve—keeping USDJPY elevated, particularly amid rising energy prices that are worsening Japan’s terms of trade. At the same time, escalating tensions around the Strait of Hormuz are a critical swing factor: higher oil prices are negative for Japan’s import-heavy economy and weigh on the Yen, while any sustained risk-off shock could eventually revive safe-haven demand. On the domestic side, the Bank of Japan is gradually shifting, with a recent rate hold accompanied by a notable split—three dissenters calling for a hike—reinforcing expectations of further normalization and lending some medium-term support. However, recent intervention by Japanese authorities to defend the 160 level has underscored policymakers’ discomfort with excessive weakness, though such actions are seen as more effective in smoothing volatility than reversing trends. As a result, the Yen remains driven by a tug-of-war between structural headwinds—carry, energy dynamics, and policy divergence—and emerging supports from policy normalization expectations and geopolitical uncertainty, leaving it weak in the near term but with scope for recovery should global conditions shift. | ||
| AUDUSD: technical overview | ||
| There are signs of the formation of a longer-term base with the market recovering out from a meaningful longer-term support zone. The latest monthly close back above 0.7000 takes the big picture pressure off the downside and strengthens the case for a bottom, with the focus now on a push towards 0.8000. Setbacks should now be well supported ahead of 0.6700. | ||
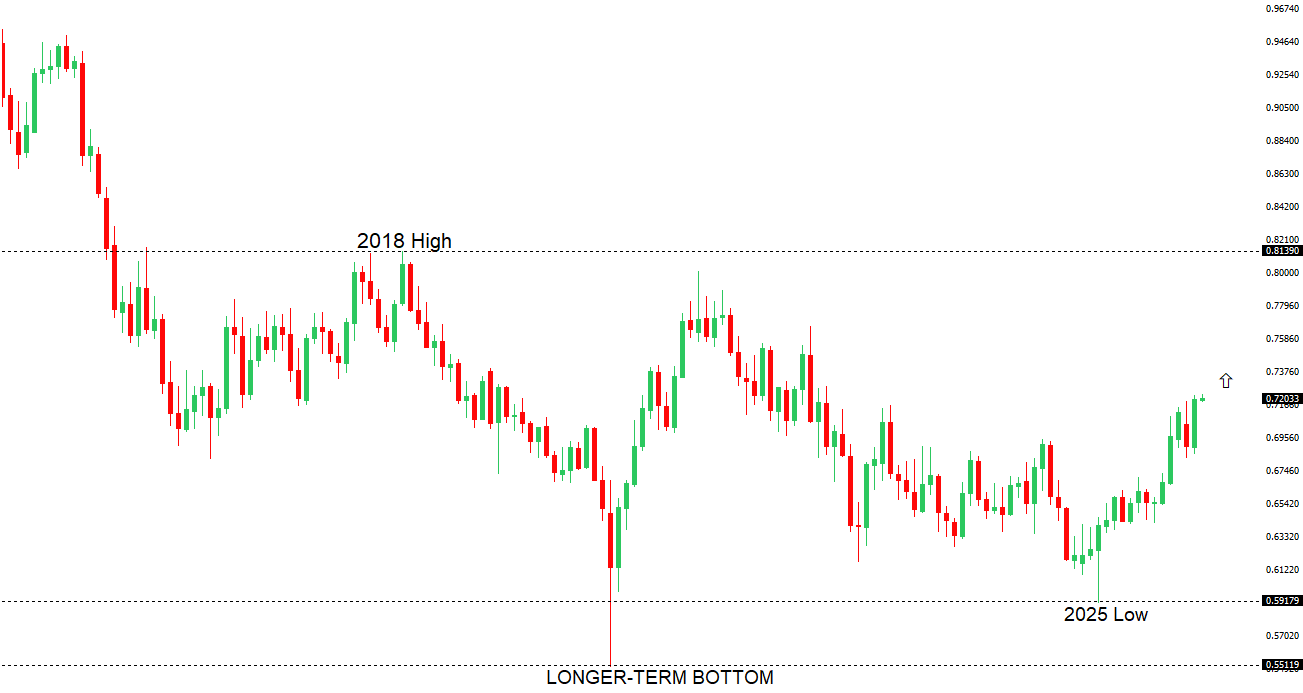 | ||
| R2 0.7300 - Figure - Medium R1 0.7228 - 1 May/2026 high - Medium S1 0.7101 - 30 April low - Medium S2 0.6963 - 8 April low - Strong | ||
| AUDUSD: fundamental overview | ||
| The Australian Dollar has come under modest pressure following the latest decision from the Reserve Bank of Australia, despite the Bank delivering the expected 25bp hike to 4.35%, as markets interpreted the overall message as less hawkish at the margin. While the policy move reinforces that inflation remains a concern—particularly with energy and commodity price shocks from the Middle East feeding into the outlook and raising the risk of second-round effects—the accompanying guidance signaled a clear shift toward patience. Governor Bullock emphasized that policy is now “a bit restrictive,” and that the Bank has scope to assess how the inflation shock evolves, effectively validating expectations for a pause after three consecutive hikes. This nuance has limited further upside for the AUD, with much of the tightening already priced in and little incremental hawkishness to drive yields higher. As a result, while the currency continues to draw underlying support from elevated rate levels and persistent inflation risks, the transition toward a wait-and-see stance—alongside lingering concerns around growth and global uncertainty—is tempering bullish momentum and leaving the Aussie more vulnerable in the near term. | ||
| Suggested reading | ||
| BlackRock’s Rick Rieder Believes Econ. Is Recession-Proof, E. Russell, Barron’s (May 1, 2026) Fed As Inflation Fighter Is Rooted In Phillips Curve Mysticism, J. Tamny, Forbes (May 1, 2026) | ||