


Today’s report: Fed speak tempers rate cut expectations
The biggest takeaway into Friday is the latest round of Fed speak. These Fed officials reiterated their stance rates should be kept restrictive for a longer period of time until there is more clear evidence inflation is heading back towards the 2% target.
Wake-up call
- ECB speak
- GBPUSD BOE Greene wants more evidence
- bond purchases
- China data
- local reads
- hotter PPI
- US CPI
- Macro themes
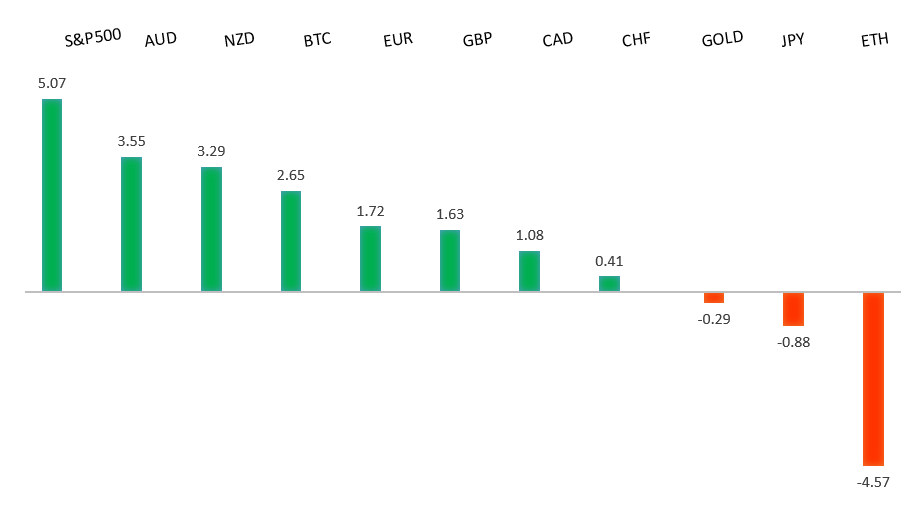
Peformance chart: 30-Day Performance vs. US dollar (%)
Suggested reading
- Sketchy Politics: Sunak's Sinking Feeling, R. Shrimsley, Financial Times (May 17, 2024)
- What's The Yield Curve Good For? Not Much, B. Elliott, CAIA (May 15, 2024)
Chart talk: Technical & fundamental highlights
Choose pair:
EURUSD – technical overview
The Euro has been in a multi-month consolidation since bottoming out in 2022. Setbacks have since been exceptionally well supported on dips below 1.0500, with a higher platform sought out ahead of the next major upside extension. Look for a push through the 2023 high at 1.1276 to strengthen the constructive outlook and extend the recovery run towards 1.2000. Only back below 1.0400 negates.EURUSD – fundamental overview
Most of what we've been hearing out of the Eurozone over the past 24 hours is a lot of ECB speak, with these central bankers backing up already priced expectations for a rate cut in June. Key standouts on Friday’s calendar come from ECB and BOE speak, Eurozone inflation, Canada housing and foreign securities purchases, and Fed speak.EURUSD - Technical charts in detail
GBPUSD – technical overview
Signs have emerged of the market wanting to put in a longer-term base after collapsing to a record low in September 2022. The latest push to a fresh 2024 high beyond 1.2830 confirms the outlook and opens the door for the next major upside extension towards the 2023 high at 1.3143. Any setbacks should now be well supported ahead of 1.2000.GBPUSD – fundamental overview
We got some hawkish leaning speak out of the UK on Thursday, this after BOE Greene was out saying more conclusive evidence was needed to show that strong inflation pressures in the UK were waning. Key standouts on Friday’s calendar come from ECB and BOE speak, Eurozone inflation, Canada housing and foreign securities purchases, and Fed speak.USDJPY – technical overview
The market remains confined to a strong uptrend, most recently extending to a multi-year high through 160.00. Key support comes in at 151.95, with only a weekly close below to delay the constructive outlook.USDJPY – fundamental overview
The BOJ kept bond purchases unchanged and the Yen was back to trading under pressure. Key standouts on Friday’s calendar come from ECB and BOE speak, Eurozone inflation, Canada housing and foreign securities purchases, and Fed speak.AUDUSD – technical overview
There are signs of the potential formation of a longer-term base with the market trading down into a meaningful longer-term support zone. Only a monthly close below 0.6200 would give reason for rethink. Back above 0.6900 will take the big picture pressure off the downside and strengthen case for a bottom.AUDUSD – fundamental overview
The Australian Dollar is feeling some Friday pressure from the latest batch of China data which was on the whole softer than expected. Indeed, China industrial production was above forecast. But this was overshadowed by softer retail sales, fixed asset investment and home price data. Key standouts on Friday’s calendar come from ECB and BOE speak, Eurozone inflation, Canada housing and foreign securities purchases, and Fed speak.USDCAD – technical overview
Above 1.3000 signals an end to a period of longer-term bearish consolidation and suggests the market is in the process of carving out a more significant longer-term base. Next key resistance now comes in up into the 1.4000 area. Setbacks should be very well supported down into the 1.3000 area.USDCAD – fundamental overview
The Canadian Dollar has been a clear underperformer this week, tracking lower against the Buck despite a wave of Dollar selling on softer US economic data. The relative weakness has been attributed to a sour run of Canada economic data that has been more than offsetting. Key standouts on Friday’s calendar come from ECB and BOE speak, Eurozone inflation, Canada housing and foreign securities purchases, and Fed speak.NZDUSD – technical overview
Overall pressure remains on the downside with the market continuing to stall out on runs up into the 0.6500 area. At the same time, there are some signs of the market wanting to put in a longer-term base. Ultimately, a break back above 0.6500 would be required to take the medium-term pressure off the downside and encourage this prospect. A monthly close below 0.5800 will intensify bearish price action.NZDUSD – fundamental overview
The New Zealand Dollar is holding up better than its Aussie cousin on Friday, with the currency getting some fresh bids on the back of a hotter than expected New Zealand producer prices print. Key standouts on Friday’s calendar come from ECB and BOE speak, Eurozone inflation, Canada housing and foreign securities purchases, and Fed speak.US SPX 500 – technical overview
Longer-term technical studies continue to look quite extended after pushing to fresh record highs, begging for a deeper correction ahead. Look for rallies to be well capped ahead of 5500. Next key support comes in at 4921.US SPX 500 – fundamental overview
Though we have seen a healthy adjustment of investor expectations towards the amount of rate cuts in 2024, the market still hopes policy will end up erring more towards the investor friendly, accommodative side of things. This bet has kept stocks well bid into dips and consistently pushing record highs.GOLD (SPOT) – technical overview
The 2019 breakout above the 2016 high at 1375 was a significant development, opening the door for fresh record highs. Setbacks should now be well supported above 1900 on a monthly close basis ahead of the next major upside extension towards 2500.GOLD (SPOT) – fundamental overview
The yellow metal has pushed record highs in 2024 with solid demand from medium and longer-term accounts. These players are more concerned about inflation, geopolitical risk and a less upbeat global growth outlook. All of this should keep the commodity well supported, with many market participants also fleeing to the hard asset as the grand dichotomy of record high equities and record low yields comes to an end.