


|
||
| 14th April 2025 | view in browser | ||
| De-escalation sparks rally, Dollar falters | ||
|
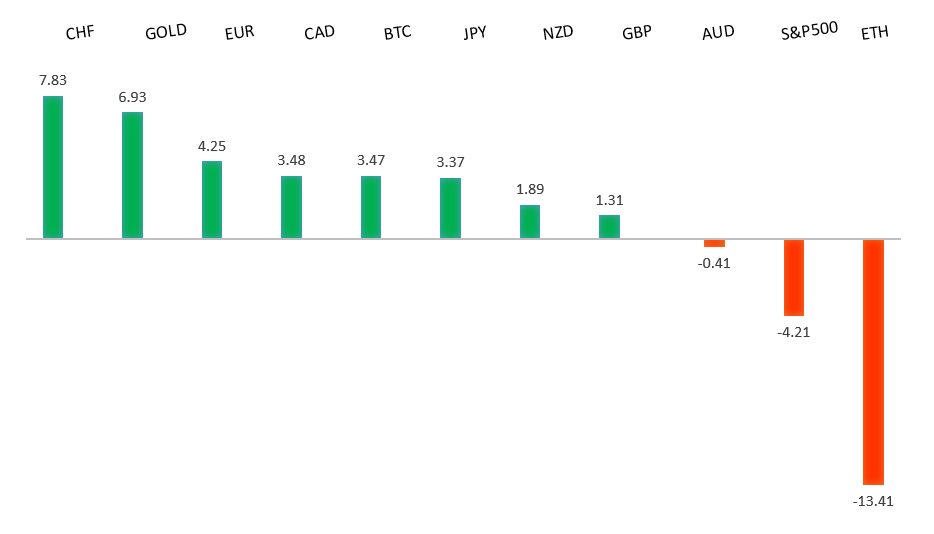
Risk appetite has recovered for now, though the 90-day pause on reciprocal tariffs is still viewed as a tactical move to alleviate intense market stress rather than signaling a shift from the U.S. administration’s “America First” stance. |
||
| Performance chart 30day v. USD (%) | ||
|
||
| Technical & fundamental highlights | ||
| EURUSD: technical overview | ||
|
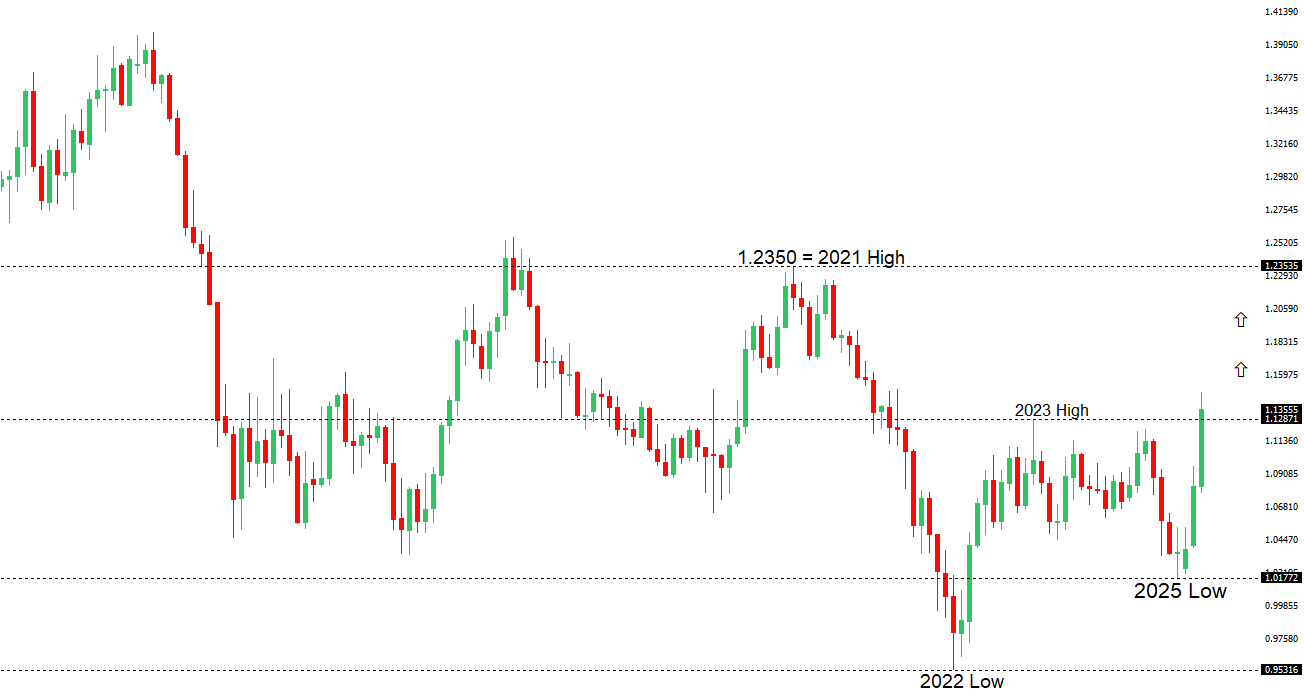
The Euro has finally broken out from a multi-month consolidation off a critical longer-term low. This latest push through the 2023 high lends further support to the case for a meaningful bottom, setting the stage for a bullish structural shift and the next major upside extension targeting the 2021 high at 1.2350. Setbacks should be exceptionally well supported below 1.1000. |
||
|
||
| R2 1.1496 - 2022 high - Strong - S1 1.1181 - 11 April low - Medium | ||
| R1 1.1474 - 11 April/2025 high - Strong - S2 1.1000 - Psychological - Strong | ||
| EURUSD: fundamental overview | ||
|
The Euro has resumed its uptrend, extending to a three-year peak at 1.1474. The single currency is gaining as a haven asset amid a flight from U.S. assets, while the dollar’s yield advantage weakens, diverging from the German 10-year and U.S. 10-year yield spread. Meanwhile, the EU’s pause on U.S. tariffs and pursuit of diversified trade partnerships signal a strategic shift amid U.S. policy uncertainty. The ECB is expected to cut rates by 25 basis points on April 17, with markets pricing in 78bps of cuts this year, reflecting disinflationary pressures from U.S. tariffs. Key standouts on Monday’s calendar come from US consumer inflation expectations and Fed speak. |
||
| GBPUSD: technical overview | ||
|
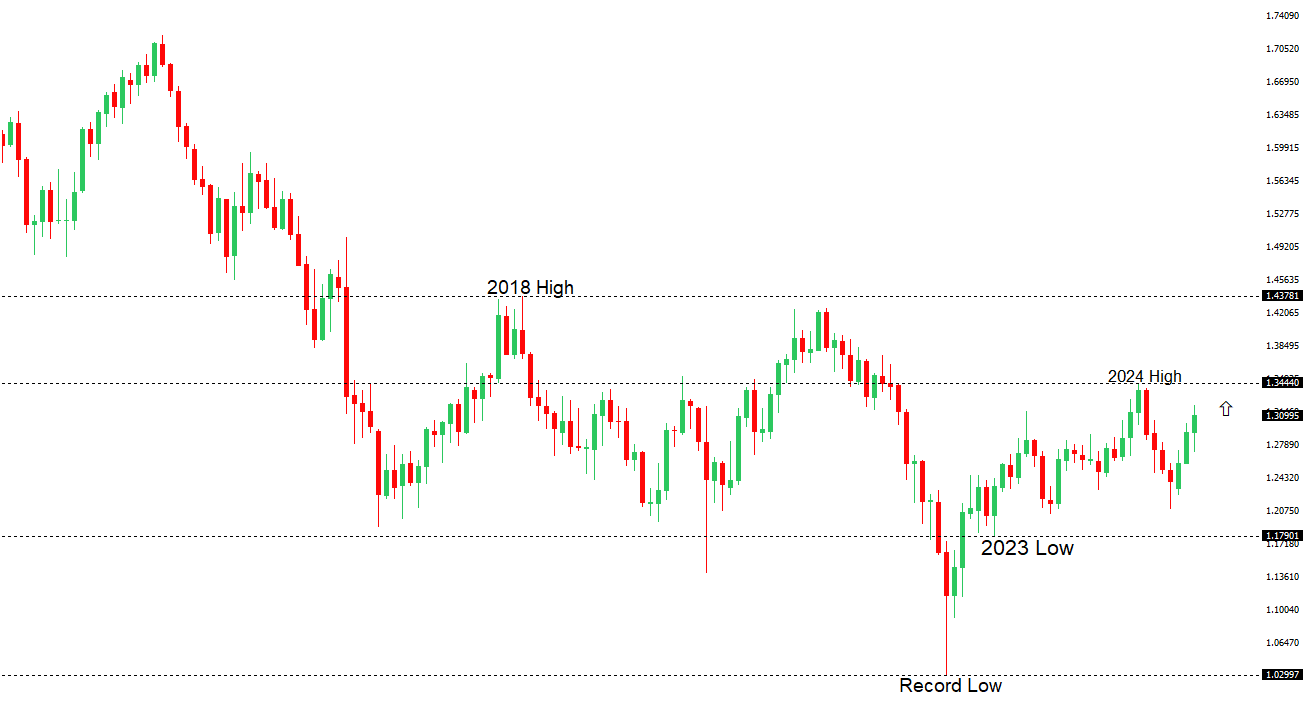
Signs have emerged of the market wanting to put in a longer-term base after collapsing to a record low in September 2022. The door is now open for the next major upside extension towards the 2018 high at 1.4377. Setbacks should be well supported above 1.2000 on a monthly close basis. |
||
|
||
| R2 1.3208 - 3 April/2025 high - Strong - S1 1.2965 - 11 April low - Medium | ||
| R1 1.3145 - 11 April high - Medium - S2 1.2795 - 10 April low - Medium | ||
| GBPUSD: fundamental overview | ||
|
The Pound remains in demand, driven by broad based US Dollar selling and robust UK economic data. The latest round of impressive UK data includes a 0.5% month-on-month GDP increase, reversing a prior 0.1% decline. Meanwhile, industrial production surged to 1.5% from -0.9%, and manufacturing hit a 2022 peak at 2.2%, up from -1.1%, signaling strong economic momentum. Key standouts on Monday’s calendar come from US consumer inflation expectations and Fed speak. |
||
| USDJPY: technical overview | ||
|
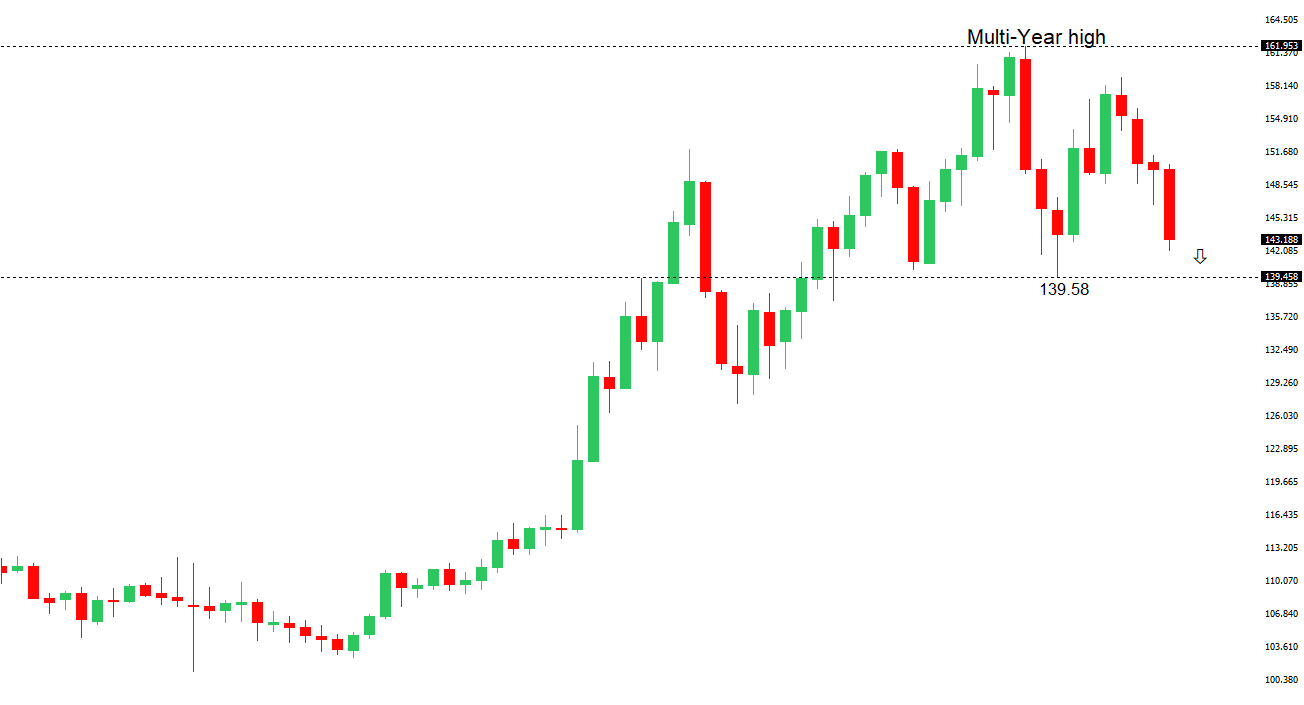
There are signs of a meaningful top in place after the market put in a multi-year high in 2024. At this point, the door is now open for a deeper setback towards the 140 area over the coming sessions. |
||
|
||
| R2 146.54 - 11 March low - Strong - S1 142.06 - 11 April/2025 low - Medium | ||
| R1 144.58 - 11 April high - Medium - S2 141.64 - 30 September low - Medium | ||
| USDJPY: fundamental overview | ||
|
Then Yen has emerged as a top-performing G10 currency, driven by safe-haven demand amid escalating U.S.-China trade tensions. Japanese household inflation expectations have surged to a 9.6% average over the next five years, the highest since June 2006, potentially reviving BOJ rate hike expectations if U.S.-Japan trade talks on April 17, involving U.S. Treasury Secretary Scott Bessent and Trade Representative Jamieson Greer, lead to pressure for a stronger yen to address trade imbalances. Markets may increase yen longs ahead of the talks, anticipating Japan could secure a favorable deal, especially as OIS markets currently expect a BOJ rate hike pause but could shift if tariff negotiations spotlight the yen. Key standouts on Monday’s calendar come from US consumer inflation expectations and Fed speak. |
||
| AUDUSD: technical overview | ||
|
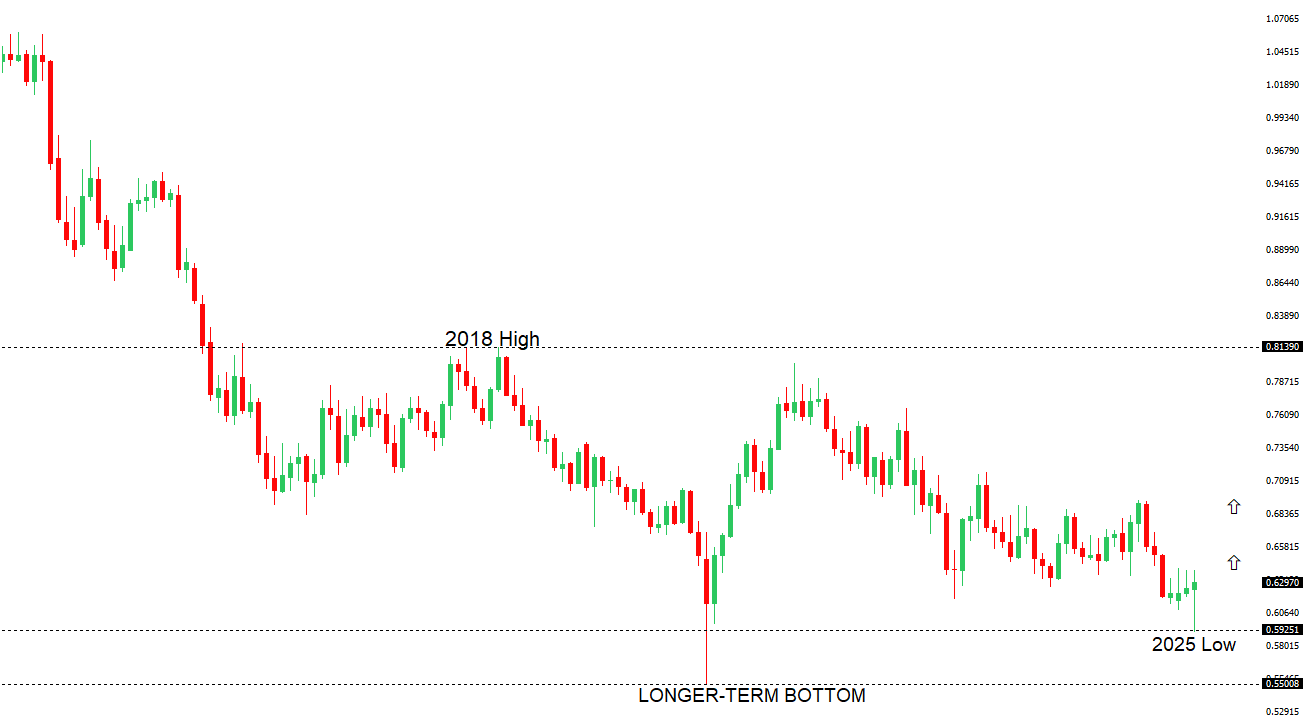
There are signs of the potential formation of a longer-term base with the market trading down into a meaningful longer-term support zone. Only a monthly close below 0.5500 would give reason for rethink. A monthly close back above 0.7000 will take the big picture pressure off the downside and strengthen case for a bottom. |
||
|
||
| R2 0.6332 - 4 April high - Medium - S1 0.6115 - 10 April low - Medium | ||
| R1 0.6315 - 14 April high - Medium - S2 0.5914 - 9 April/2025 low - Strong | ||
| AUDUSD: fundamental overview | ||
|
The Australian dollar faces headwinds as a yuan proxy amid U.S.-China trade tensions, with the yuan fixing at its weakest since September 2023. Many analysts expect China to avoid a sharp devaluation, prioritizing global stability, reducing the likelihood of revisiting its COVID-era low of 0.5510. RBA Governor Bullock has resisted pressure for a 50bps rate cut in May, citing the need to assess global demand and supply impacts from U.S. tariffs, but OIS markets still price in a certain cut, driven by economic growth concerns outweighing inflation risks, as seen in past crises. Contrarian strategists argue the Australian Dollar may be oversold, with China’s potential stimulus expansion expected to be discussed Thursday, likely to boost demand for Australian commodities, while the RBA remains cautiously optimistic about China’s infrastructure and monetary measures offsetting trade war effects. Key standouts on Monday’s calendar come from US consumer inflation expectations and Fed speak. |
||
| Suggested reading | ||
|
U.S. and China Wrestling for Global Leadership, M. Vassalou, Barron’s (April 11, 2025) US would be better off without the global dollar, M. Pettis, Financial Times (April 11, 2025) |
||