


|
||
| 11th April 2025 | view in browser | ||
| Euro becoming currency of choice | ||
|
The US-China trade war has intensified with tariffs on China now at 145%. President Trump has threatened to impose reciprocal tariffs on up to 70 countries within three months if trade deals aren’t reached, creating significant policy uncertainty that markets dread, especially given the complexity and time typically required for such negotiations. |
||
| Performance chart 30day v. USD (%) | ||

|
||
| Technical & fundamental highlights | ||
| EURUSD: technical overview | ||
|
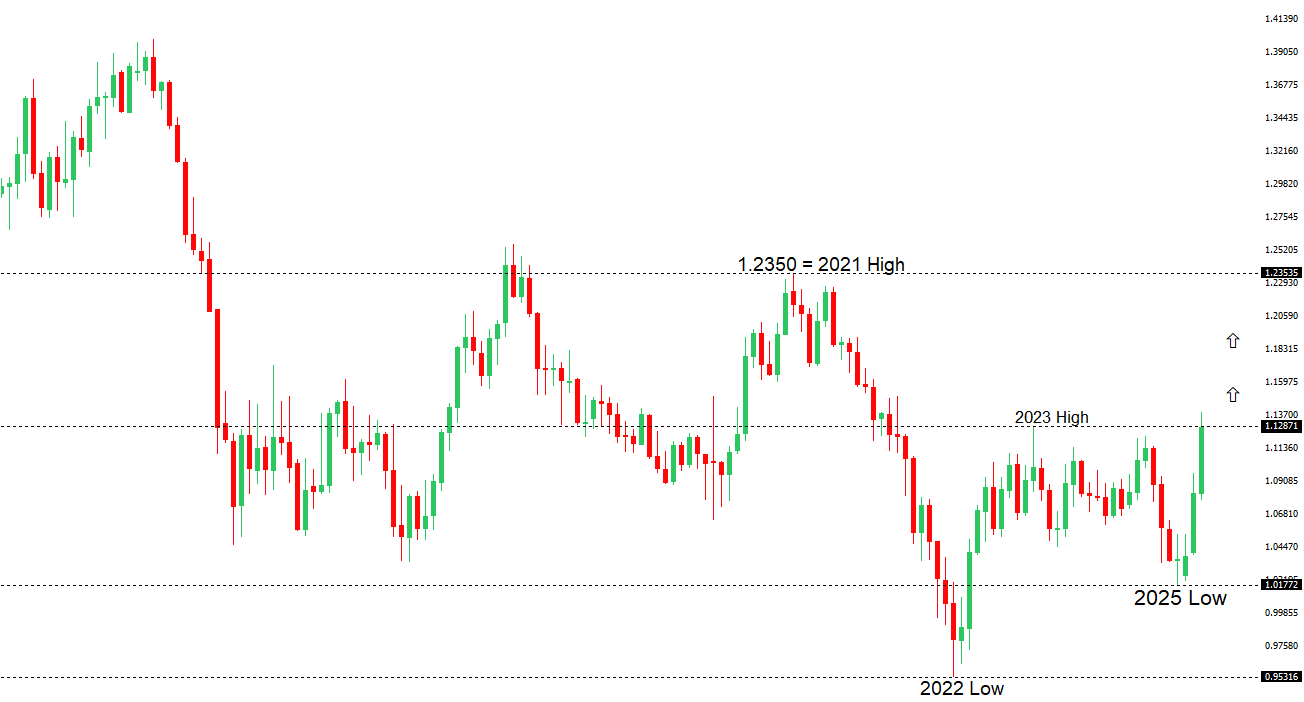
The Euro has finally broken out from a multi-month consolidation off a critical longer-term low. This latest push through the 2023 high lends further support to the case for a meaningful bottom, setting the stage for a bullish structural shift and the next major upside extension targeting the 2021 high at 1.2350. Setbacks should be exceptionally well supported below 1.1000. |
||
|
||
| R2 1.1400 - Figure - Medium - S1 1.1181 - 11 April low - Medium | ||
| R1 1.1385 - 11 April/2025 high - Strong - S2 1.1000 - Psychological - Strong | ||
| EURUSD: fundamental overview | ||
|
EU Commission President Ursula von der Leyen has suspended planned tariffs on US products for 90 days, following a US call for a pause on reciprocal tariffs, to allow time for negotiations. Friedrich Merz, Germany’s likely next chancellor, supports dialogue but stresses the EU’s readiness to protect its interests, noting that Trump’s unpredictable approach has created uncertainty and criticism in the US. Bloomberg economists predict a 25bps ECB rate cut on April 17, expecting US tariffs to reduce euro area demand and inflation, with markets anticipating 75bps in cuts over the year. Key standouts on Friday’s calendar come from German inflation data, UK GDP, trade, industrial production, construction output, an ECB Lagarde speech, US producer prices, Michigan sentiment, and Fed speak. |
||
| USDJPY: technical overview | ||
|
There are signs of a meaningful top in place after the market put in a multi-year high in 2024. At this point, the door is now open for a deeper setback towards the 140 area over the coming sessions. |
||

|
||
| R2 146.54 - 11 March low - Strong - S1 142.88 - 11 April/2025 low - Medium | ||
| R1 144.58 - 11 April high - Medium - S2 141.64 - 30 September low - Medium | ||
| USDJPY: fundamental overview | ||
|
Then Yen has extended its run against the US Dollar amid escalating US-China trade tensions. The US Trade Secretary attributed Yen strength to Japan’s robust economic growth and inflation expectations, suggesting BOJ rate hikes are natural. Japan faces potential US pressure to raise rates in upcoming trade talks to address Yen weakness and trade imbalances, with markets pricing in minimal BOJ hikes but higher odds if tariffs are moderated. Recent strong Japan PPI data (4.2% YoY vs. 3.9% forecast) supports rate hike speculation. Japan’s strategic importance and Trump’s appointment of key negotiators could lead to lenient tariff terms, with traders eyeing more Yen gains if a favorable deal emerges. Key standouts on Friday’s calendar come from German inflation data, UK GDP, trade, industrial production, construction output, an ECB Lagarde speech, US producer prices, Michigan sentiment, and Fed speak. |
||
| AUDUSD: technical overview | ||
|
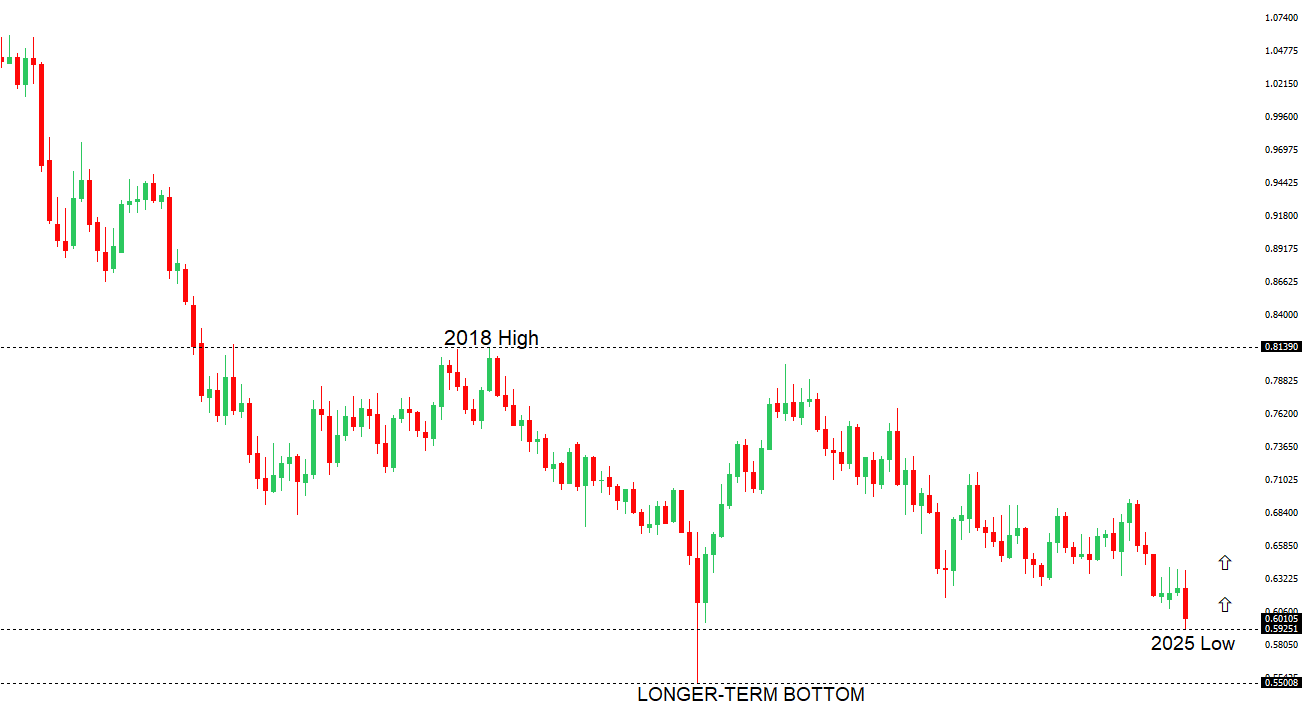
There are signs of the potential formation of a longer-term base with the market trading down into a meaningful longer-term support zone. Only a monthly close below 0.5500 would give reason for rethink. A monthly close back above 0.7000 will take the big picture pressure off the downside and strengthen case for a bottom. |
||
|
||
| R2 0.6332 - 4 April high - Medium - S1 0.6115 - 10 April low - Medium | ||
| R1 0.6259 - 11 April high - Medium - S2 0.5914 - 9 April/2025 low - Strong | ||
| AUDUSD: fundamental overview | ||
|
The Australian dollar has benefited from broad based currency demand but faces pressure as a risk-sensitive currency amid ongoing US tariffs on China, Australia’s key trading partner. But at least for now, fears of revisiting its COVID-era low of 0.5510 have eased. The yuan’s stable fixing at 7.2087 signals China’s intent to avoid sharp devaluation, prioritizing global stability over tariff countermeasures. Meanwhile, RBA Governor Bullock has resisted calls for a 50 basis point rate cut in May, emphasizing a cautious approach to US tariff impacts and noting Australia’s resilient financial system, with market volatility expected but economic fallout limited compared to 2008. Key standouts on Friday’s calendar come from German inflation data, UK GDP, trade, industrial production, construction output, an ECB Lagarde speech, US producer prices, Michigan sentiment, and Fed speak. |
||
| USDCAD: technical overview | ||
|
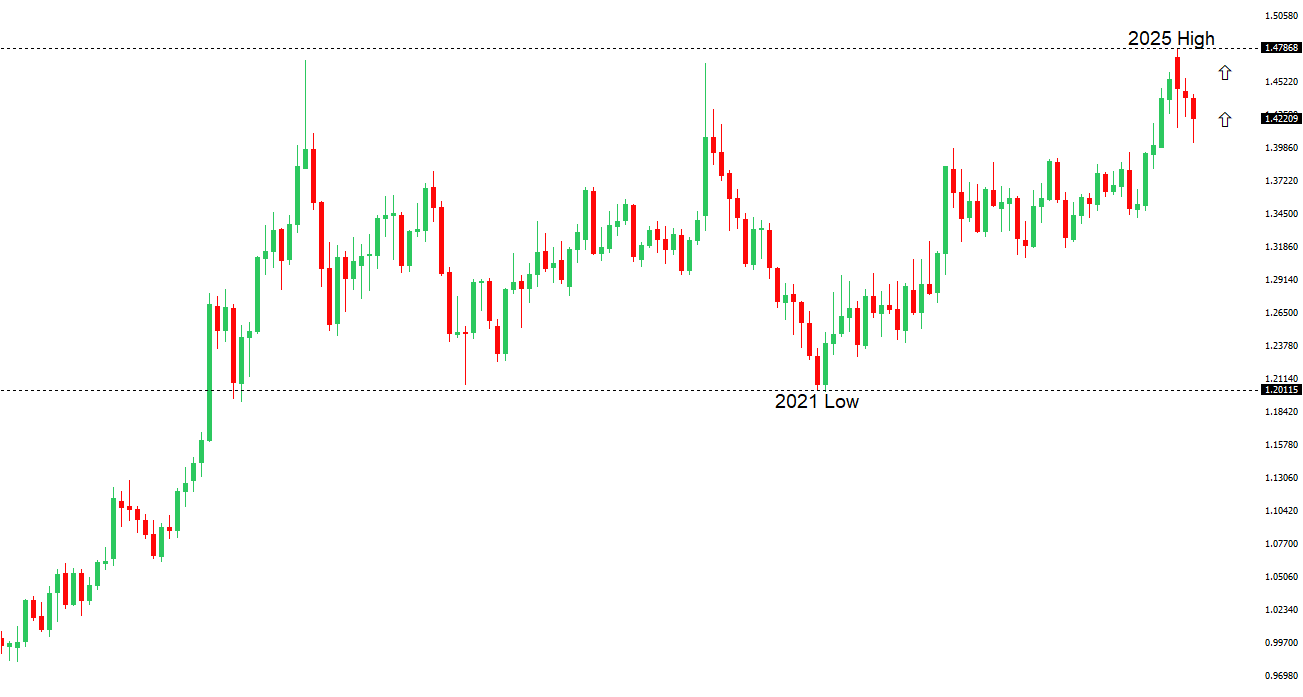
A sustained upside pressure over the past several months signals an end to a period of longer-term bearish consolidation and suggests the market is in the process of carving out a more significant longer-term base. Next key resistance now comes in at the 1.5000 psychological barrier. Setbacks should be very well supported ahead of 1.3500. |
||
|
||
| R2 1.4297 - 7 April high - Strong - S1 1.3908 - 11 April/2025 low - Medium | ||
| R1 1.4111 - 10 April high - Medium - S2 1.3817 - 6 November low - Medium | ||
| USDCAD: fundamental overview | ||
|
We’ve seen a surge in demand for the Canadian Dollar on the back of President Trump’s 90-day tariff pause. The resulting development has translated to broad based risk on flow and concurrent surge in the price of oil. Meanwhile, PM Carney has been helping the Canadian Dollar this week as well, after pledging to make Canada an energy superpower. Key standouts on Friday’s calendar come from German inflation data, UK GDP, trade, industrial production, construction output, an ECB Lagarde speech, US producer prices, Michigan sentiment, and Fed speak. |
||
| Suggested reading | ||
|
Which US Stocks Are Most at Risk From Tariffs?, I. Pontikis, Morningstar (April 10, 2025) An apology to the bond vigilantes, A. Scaggs, Financial Times (April 9, 2025) |
||