


 | ||
| 9th June 2025 | view in browser | ||
| Dollar dips as trade talks and data loom | ||
| The Buck has cooled off in the aftermath of Friday’s rally, as markets brace for a busy week of economic data and US-China trade talks in London. | ||
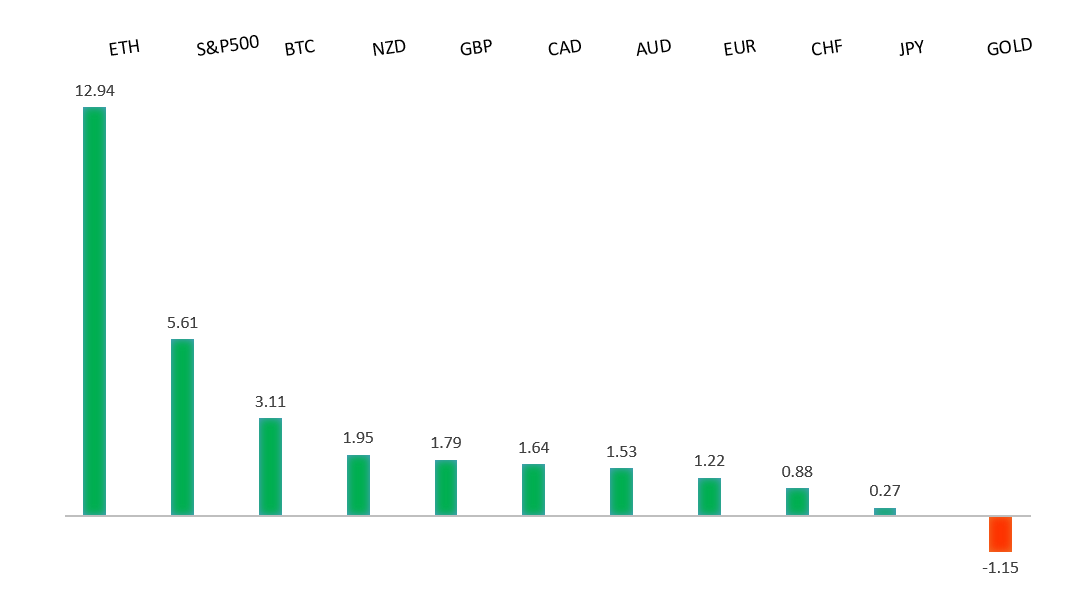
| Performance chart 30day v. USD (%) | ||
 | ||
| Technical & fundamental highlights | ||
| EURUSD: technical overview | ||
| The Euro has finally broken out from a multi-month consolidation off a critical longer-term low. This latest push through the 2023 high lends further support to the case for a meaningful bottom, setting the stage for a bullish structural shift and the next major upside extension targeting the 2021 high at 1.2350. Setbacks should be exceptionally well supported below 1.1000. | ||
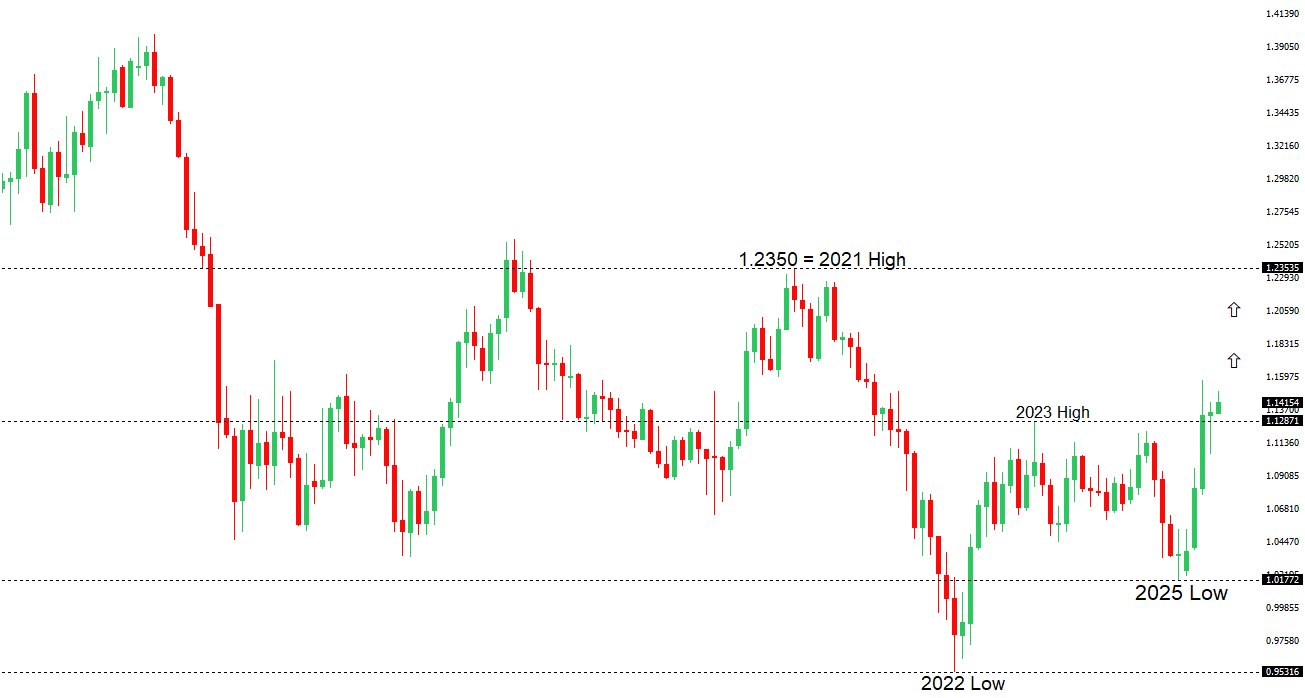 | ||
| R2 1.1574 - 21 April/2025 high - Strong R1 1.1495 - 5 June high - Medium S1 1.1210 - 29 May low - Medium S2 1.1065 - 12 May low - Strong | ||
| EURUSD: fundamental overview | ||
| The Euro is performing steadily despite a stronger dollar following the NFP release, with markets now focusing on US-China trade talks in London, led by Treasury Secretary Scott Bessent, aimed at easing ongoing trade tensions. In Europe, ECB policymaker Yannis Stournaras announced a successful “soft landing” for the eurozone, signaling the end of the easing cycle, though both he and ECB President Christine Lagarde warned that potential US tariffs could threaten growth amid heightened economic uncertainty. | ||
| USDJPY: technical overview | ||
| There are signs of a meaningful top in place after the market put in a multi-year high in 2024. At this point, the door is now open for a deeper setback below the 2024 low at 139.58 over the coming sessions exposing a retest of the 2023 low. Rallies should be well capped below 150.00. | ||
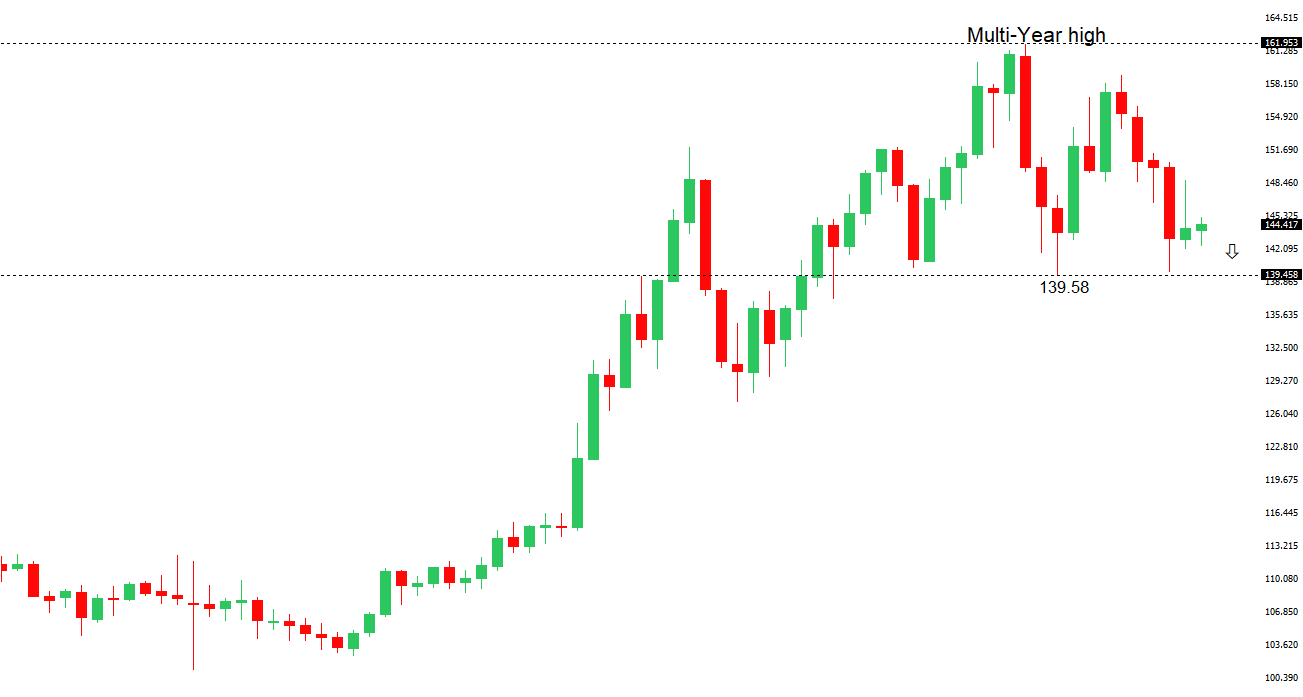 | ||
| R2 148.65 - 12 May high - Medium R1 146.29 - 29 May high - Medium S1 142.11 - 27 May low - Medium S2 141.97 - 29 April low - Medium | ||
| USDJPY: fundamental overview | ||
| Japan’s economy showed resilience in Q1 2025, with revised figures indicating flat growth instead of the initially reported 0.2% contraction, though far from the 0.6% growth of late 2024. Trade significantly boosted GDP by 0.4 points, a sharp reversal from the earlier estimated 0.8-point drag, despite a 0.5% drop in exports and a 3% surge in imports, aided by a 90-day trade truce with the Trump administration. Household spending grew slightly by 0.1%, business investment rose 1.1%, but public spending fell 0.5%, signaling potential challenges unless private spending increases. | ||
| AUDUSD: technical overview | ||
| There are signs of the potential formation of a longer-term base with the market trading down into a meaningful longer-term support zone. Only a monthly close below 0.5500 would give reason for rethink. A monthly close back above 0.7000 will take the big picture pressure off the downside and strengthen case for a bottom. | ||
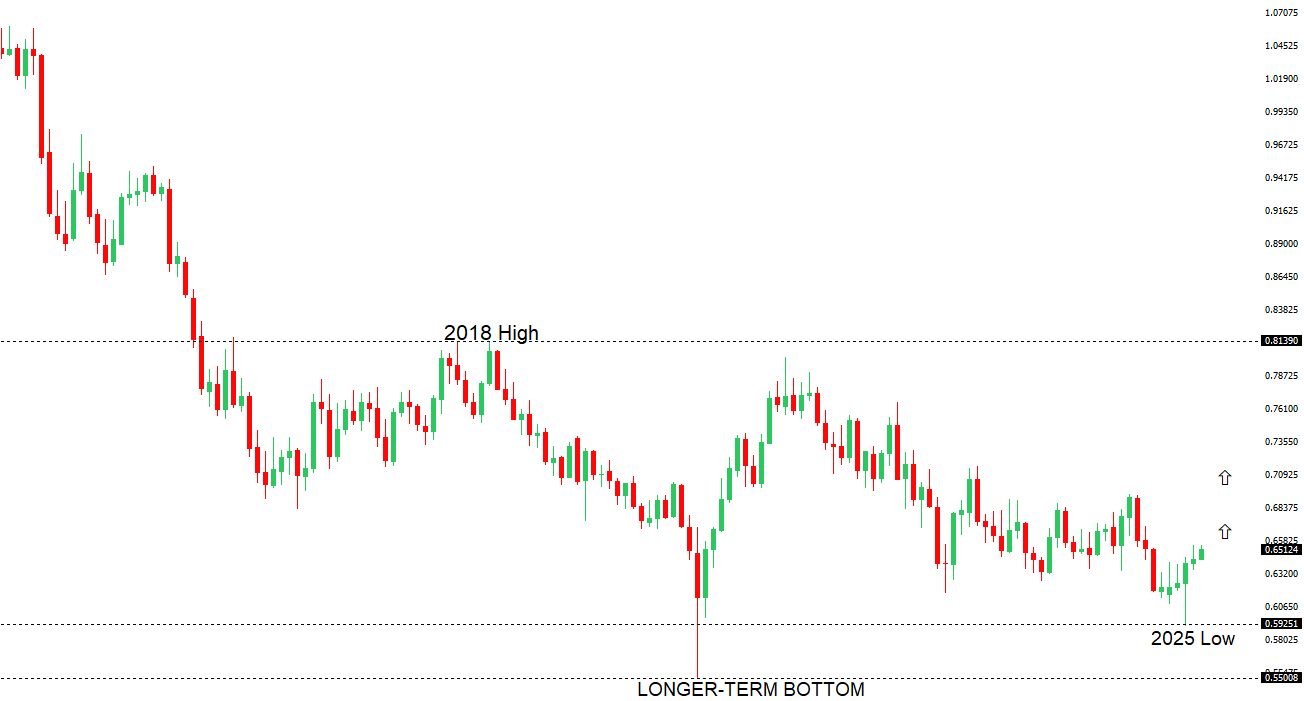 | ||
| R2 0.6550 - 25 November 2024 high - Strong R1 0.6539 - 5 June/2025 high - Medium S1 0.6344 - 24 April low - Medium S1 0.6275 - 14 April low - Strong | ||
| AUDUSD: fundamental overview | ||
| China’s trade surplus surged to $103.2 billion in May, driven by a robust 4.8% rise in exports, but a worrying 3.4% drop in imports marked the fourth consecutive month of decline, signaling weak domestic demand that could hurt Australia. Consumer and producer prices continued to fall, with deflation deepening as food prices dropped sharply, though Chinese stocks rose slightly amid optimism over renewed US-China trade talks in London. Despite the grim data, the Australian Dollar gained, even as expectations grow for a significant 35-point rate cut in Australia due to economic concerns. | ||
| Suggested reading | ||
| Why Investors Lack a Theory of Everything, Buttonwood, The Economist (June 4, 2025) A Weak Dollar Would Add To Tariff Inflation, D. Lachman, Barrons (June 6, 2025) | ||