


 | ||
| 13th August 2025 | view in browser | ||
| Dollar dives as CPI fuels rate cut bets | ||
| Heading into Wednesday’s trading session, the U.S. dollar remains under pressure after a sharp decline on Tuesday, driven by a softer-than-expected headline CPI report that solidified expectations for a September Federal Reserve rate cut, with market odds now exceeding 95%. | ||
| Performance chart 30day v. USD (%) | ||
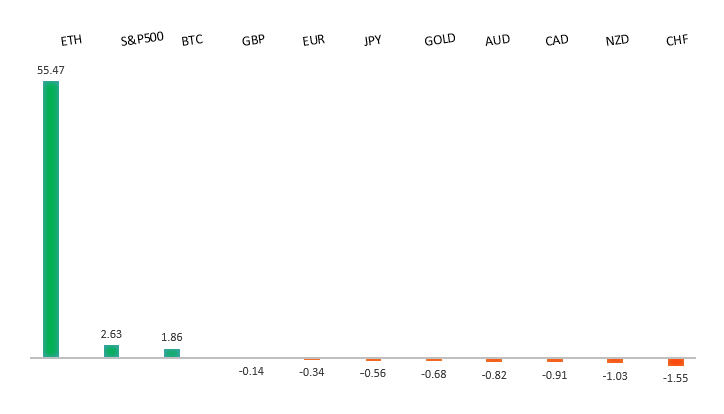 | ||
| Technical & fundamental highlights | ||
| EURUSD: technical overview | ||
| The Euro has broken out from a multi-month consolidation off a critical longer-term low. This latest push through the 2023 high (1.1276) lends further support to the case for a meaningful bottom, setting the stage for a bullish structural shift and the next major upside extension targeting the 2021 high at 1.2350. Setbacks should be exceptionally well supported ahead of 1.1000. | ||
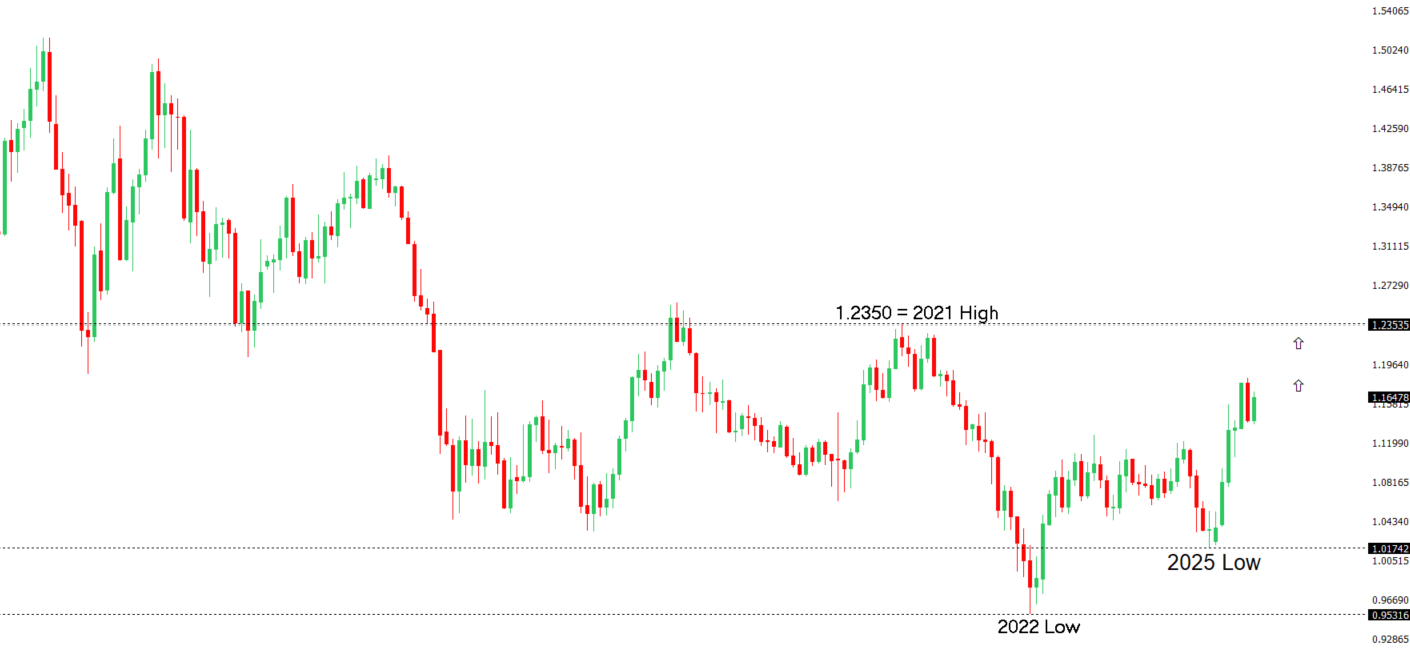 | ||
| R2 1.1789 - 24 July high - Medium R1 1.1700 - 7 August high - Medium S1 1.1528 - 5 August low - Medium S2 1.1392 - 1 August low - Strong | ||
| EURUSD: fundamental overview | ||
| The U.S. July CPI data, aligning with expectations, supports market predictions for a Federal Reserve rate cut in September, with three cuts priced in by Q1 2026, while the ECB is likely to hold rates steady in September as it nears the end of its cutting cycle, potentially strengthening the euro due to diverging central bank policies. ECB official Joachim Nagel indicated that current eurozone borrowing costs are appropriate, with inflation at 2% and not a primary concern, though caution persists due to unresolved EU-U.S. trade tariffs and their potential economic impact. Germany’s economic confidence dropped sharply, with the August ZEW Economic Sentiment Index falling to 34.7 from 52.7, driven by weak Q2 growth and concerns over U.S. tariffs impacting export industries, with the Bundesbank forecasting no growth for 2025. | ||
| USDJPY: technical overview | ||
| There are signs of a meaningful top in place after the market put in a multi-year high in 2024. At this point, the door is now open for a deeper setback below the 2024 low at 139.58, exposing a retest of the 2023 low. Rallies should be well capped below 152.00. | ||
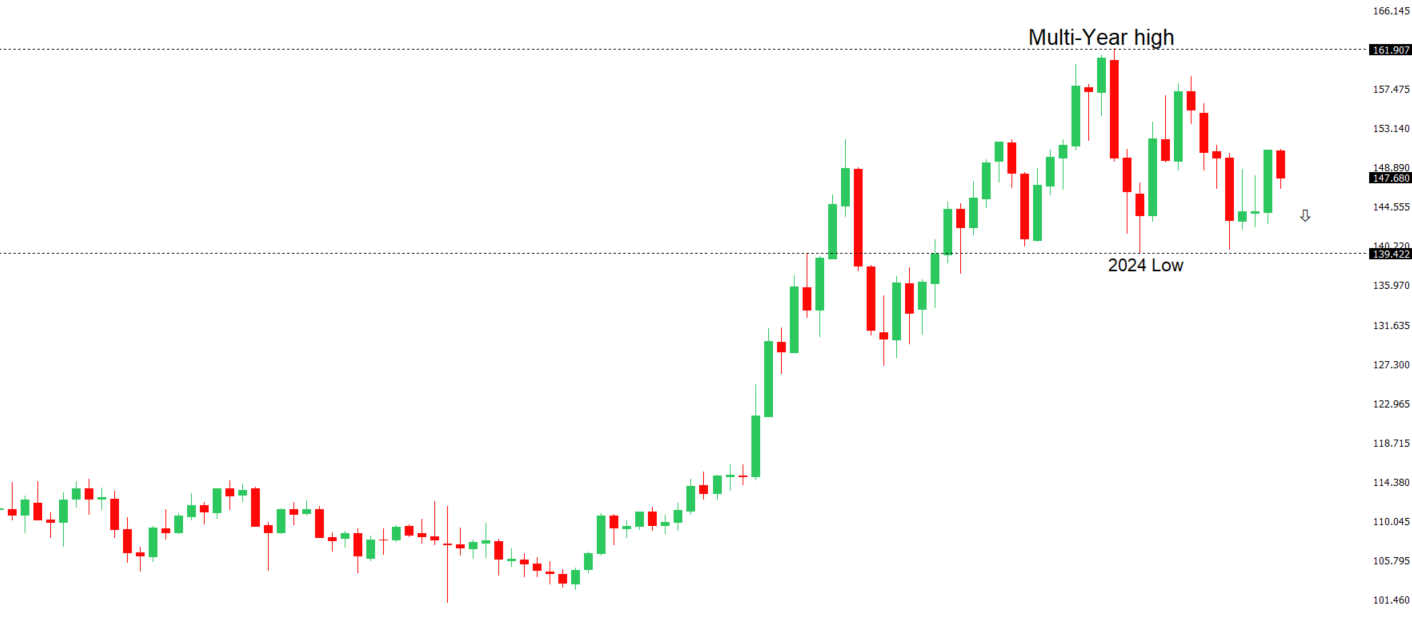 | ||
| R2 150.92 - 1 August high - Strong R1 148.52 - 12 August high - Medium S1 146.62 - 5 August low - Medium S2 145.85 - 24 July low - Strong | ||
| USDJPY: fundamental overview | ||
| Expectations of a U.S. Federal Reserve rate cut in September, following the July CPI data, have paused a run of yen declines, though the yen remains weak. Political uncertainty in Japan, driven by Prime Minister Ishiba’s coalition setbacks in recent elections, has fueled yen depreciation and raised concerns about increased government spending and fiscal challenges. Despite internal LDP pressure for Ishiba’s resignation, he remains in place, with a party review set for late August, likely sustaining market volatility and yen weakness. Meanwhile, the Bank of Japan’s July meeting summary indicates a hawkish tilt, with growing inflation concerns potentially leading to a rate hike by year-end if U.S. tariffs have minimal impact and domestic inflation persists. Recent Japanese data showed July PPI slightly above forecasts at 2.6% year-on-year and 0.2% month-on-month. | ||
| AUDUSD: technical overview | ||
| There are signs of the potential formation of a longer-term base with the market trading down into a meaningful longer-term support zone. Only a monthly close below 0.5500 would give reason for rethink. A monthly close back above 0.7000 will take the big picture pressure off the downside and strengthen case for a bottom. | ||
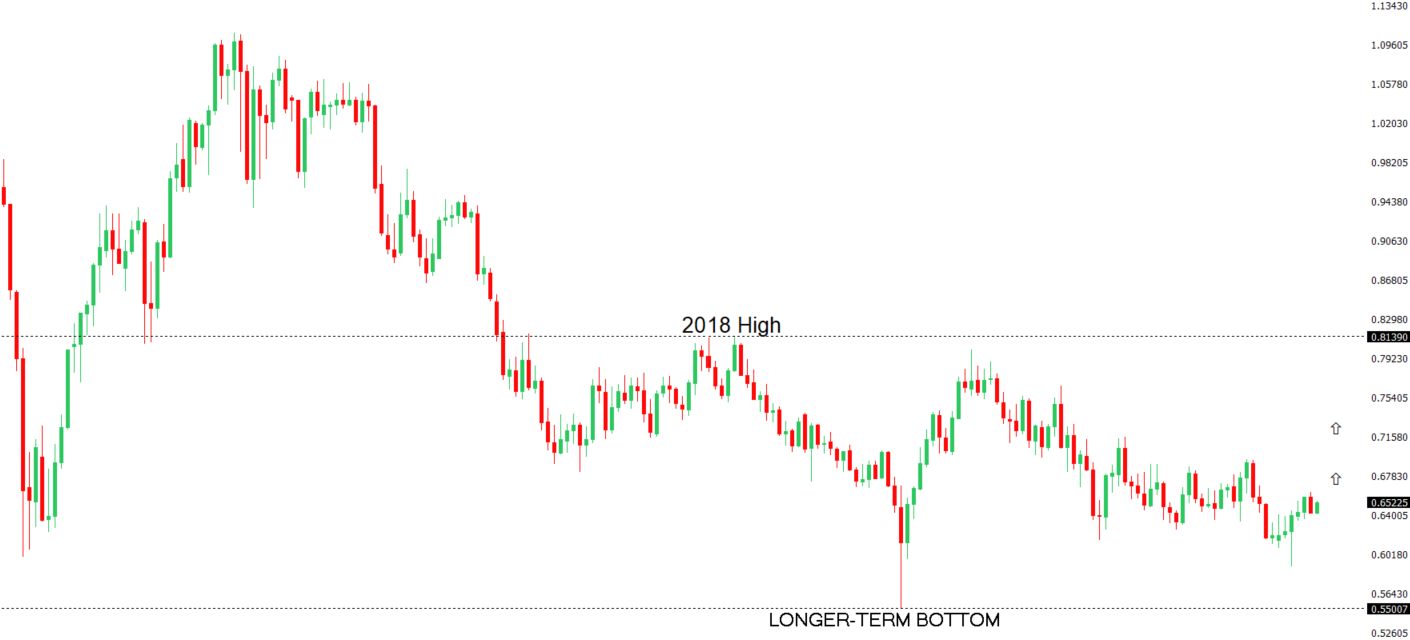 | ||
| R2 0.6600 - Figure - Medium R1 0.6542 - 7 August high - Medium S1 0.6419 - 1 August low - Medium S1 0.6373 - 23 June low - Strong | ||
| AUDUSD: fundamental overview | ||
| The Reserve Bank of Australia lowered its cash rate by 25 basis points to 3.60%, marking the third rate cut this year and bringing rates to a two-year low. The RBA adopted a more dovish stance, citing weaker economic growth forecasts, with GDP growth for 2025 reduced to 1.7% from 2.1%. Inflation is expected to peak at 3.1% in mid-2026 before settling at 2.5% by late 2027, within the target range, while unemployment holds steady at 4.3%. Economists anticipate further rate cuts, potentially reaching 3.35% by year-end and 3.10% in early 2026, as growth slows and inflation remains manageable. | ||
| Suggested reading | ||
| Does CPI Represent True Inflation? R. Forsyth, Barron’s (August 8, 2025) Five Possible Ways to Stop the National Debt Disaster, G. Will, Washington Post (August 8, 2025) | ||