


 | ||
| 13th March 2026 | view in browser | ||
| Dollar firms as geopolitics and yields dominate | ||
| The Dollar Index is pushing to fresh 2026 highs as rising geopolitical tensions around Iran, firm US yields, and oil nearing $100 support the dollar, all while markets brace for a heavy slate of data led by US core PCE and key UK and Canadian releases. | ||
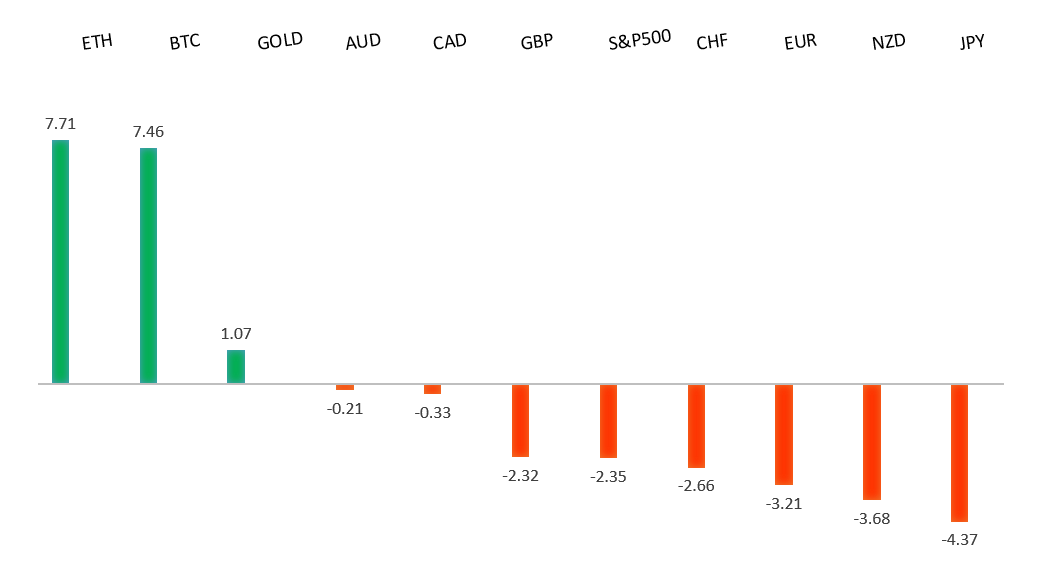
| Performance chart 30day v. USD (%) | ||
 | ||
| Technical & fundamental highlights | ||
| EURUSD: technical overview | ||
| The Euro outlook remains constructive with higher lows sought out on dips in favor of the next major upside extension targeting the 2021 high at 1.2350. Setbacks should be exceptionally well supported ahead of 1.1400. | ||
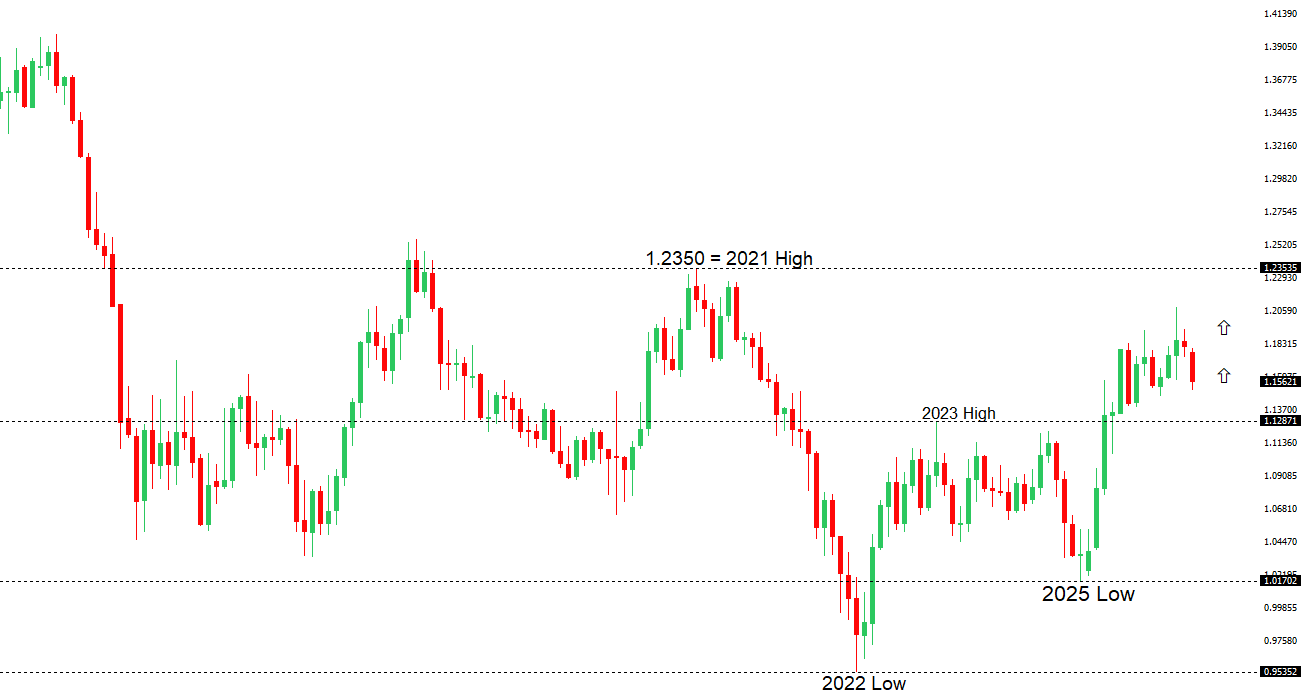 | ||
| R2 1.1707 - 3 March high - Strong R1 1.1668 - 10 March high - Medium S1 1.1469 - 5 November low - Strong S2 1.1400 - Figure - Strong | ||
| EURUSD: fundamental overview | ||
| The euro is on track for a fourth straight day of losses, remaining below its 200-day moving average since breaking down on 3 March. The war has pushed oil prices up nearly 30% and European gas more than 50%, leading markets to price in roughly 20–25 bps of ECB tightening by July and about 40 bps by year-end, even though the central bank is widely expected to keep rates unchanged at next week’s meeting. While some policymakers warn that higher energy costs could lift inflation and bring rate hikes sooner than expected, the ECB—led by Christine Lagarde—is likely to maintain a cautious, data-dependent tone amid elevated uncertainty and softer growth risks. In the near term, this backdrop points to the euro staying range-bound with a downside bias, with rallies likely capped near the 200-day moving average unless US data or geopolitical developments materially shift the outlook. | ||
| USDJPY: technical overview | ||
| There are signs of the formation of a meaningful top after the market put in a multi-year high in 2024. At this point, rallies should be well capped above 160.00 in favor of a fresh down-leg back towards the 2024 low at 139.58. Only a monthly close above 160.00 negates. | ||
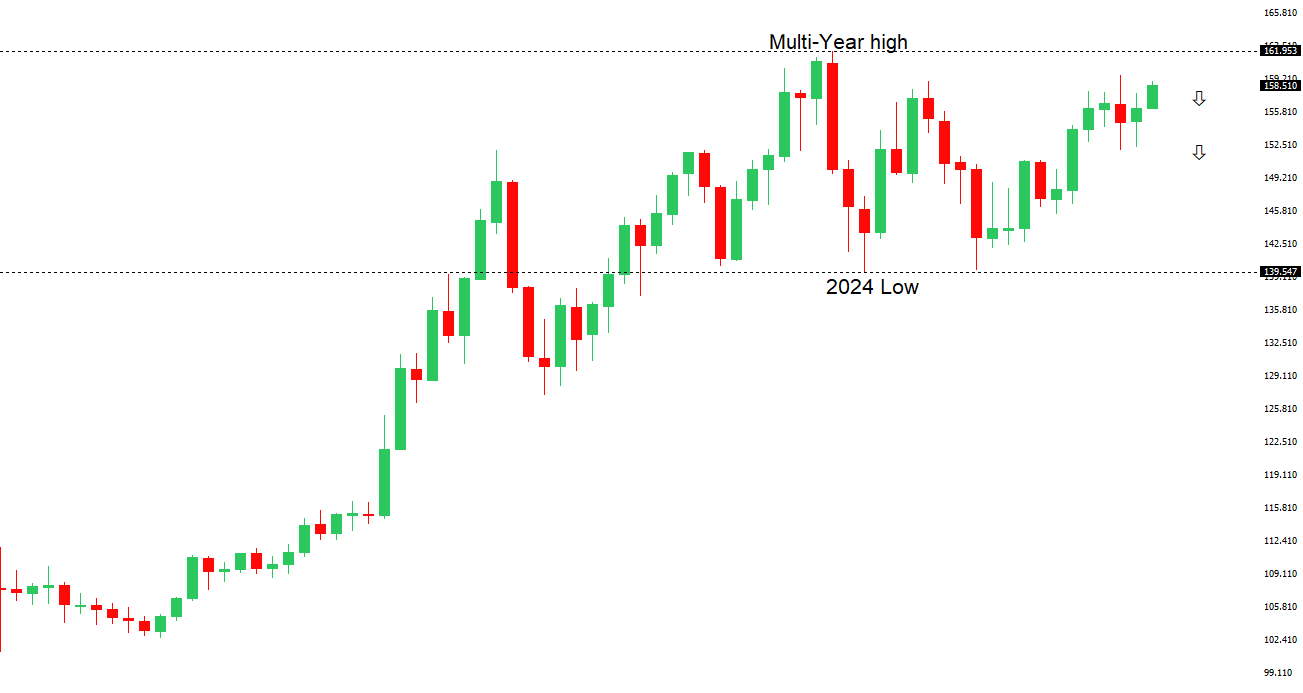 | ||
| R2 160.00 - Psychological - Strong R1 159.69 - 13 March/2026 high - Medium S1 157.27 - 10 March low - Medium S2 156.45 - 5 March low - Strong | ||
| USDJPY: fundamental overview | ||
| The yen is hovering near its weakest levels since July 2024, with USDJPY approaching the 160 area after recently hitting a fresh YTD high, raising renewed concerns about potential intervention. BOJ Governor Kazuo Ueda warned that a weaker yen could intensify imported inflation, especially as oil prices rise, while stressing that policymakers will monitor how FX moves impact the inflation outlook. The latest gains in USDJPY are being driven by a stronger dollar and surging energy costs, which are worsening Japan’s terms of trade and reinforcing a stagflation-like backdrop that pressures real incomes. With Brent crude back above $100 and Japan heavily reliant on imported energy, the environment continues to weigh on the yen, while markets increasingly believe the previous intervention “line in the sand” near 158–159 has shifted closer to 160–162. For now, policymakers appear more focused on preventing disorderly volatility than defending specific levels, and with oil elevated and US data firm, risks remain tilted toward a near-term push into the 160s. | ||
| AUDUSD: technical overview | ||
| There are signs of the formation of a longer-term base with the market recovering out from a meaningful longer-term support zone. The latest monthly close back above 0.7000 takes the big picture pressure off the downside and strengthens the case for a bottom, with the focus now on a push towards 0.8000. Setbacks should now be well supported ahead of 0.6700. | ||
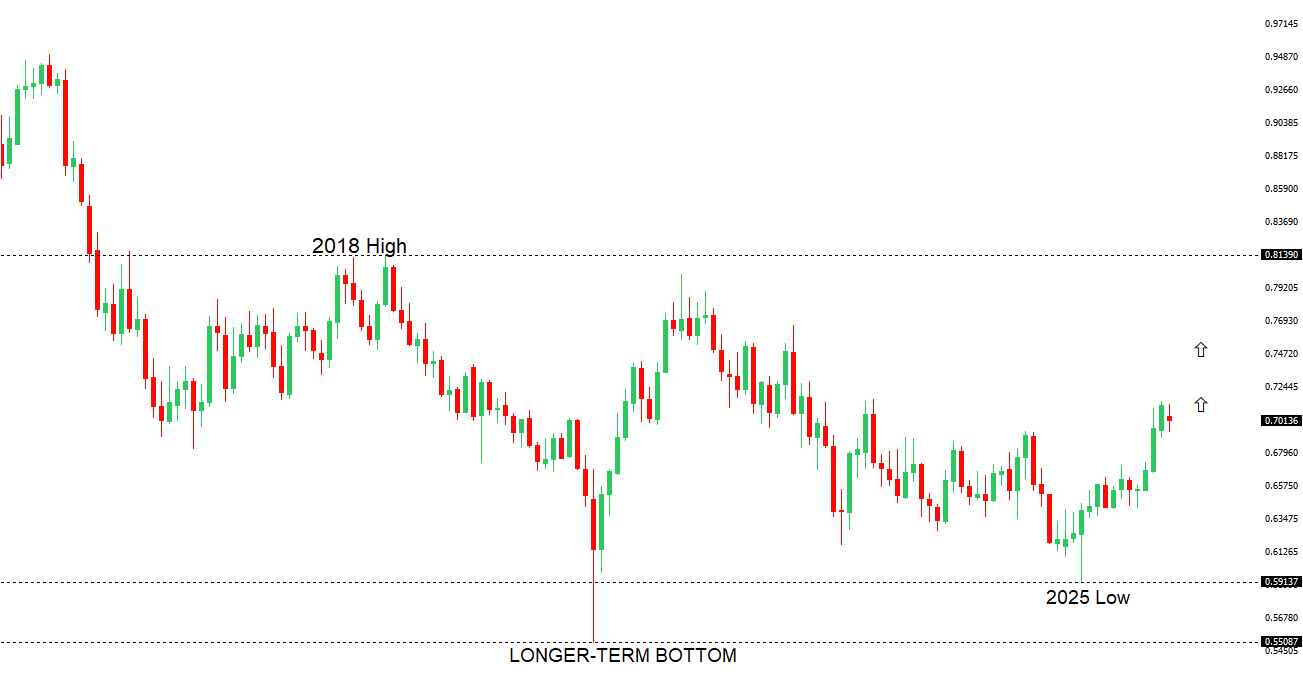 | ||
| R2 0.7200 - Figure - Medium R1 0.7188 - 11 March/2026 high - Medium S1 0.6944 - 3 March low - Medium S2 0.6897 - 6 February low - Strong | ||
| AUDUSD: fundamental overview | ||
| The Australian dollar is extending Thursday’s roughly 1.1% drop but still looks set to finish the week higher. Expectations for tighter policy are supporting the currency, with major banks now forecasting a 25bp RBA hike to 4.1% on March 17 and markets pricing about a two-thirds chance of the move, with some even anticipating another hike in May if energy-driven inflation persists. Strong demand from investors seeking higher Australian yields has also boosted AUD positioning. | ||
| Suggested reading | ||
| Why The Fed Needs To Ease Now, S. Grannis, Calafia Beach Pundit (March 10, 2026) Money Is Not The Destination. It’s Only A Tool, D. Hagen, Meaningful Money (March 10, 2026) | ||