


 | ||
| 8th June 2026 | view in browser | ||
| Hawkish Fed fears meet Middle East tensions | ||
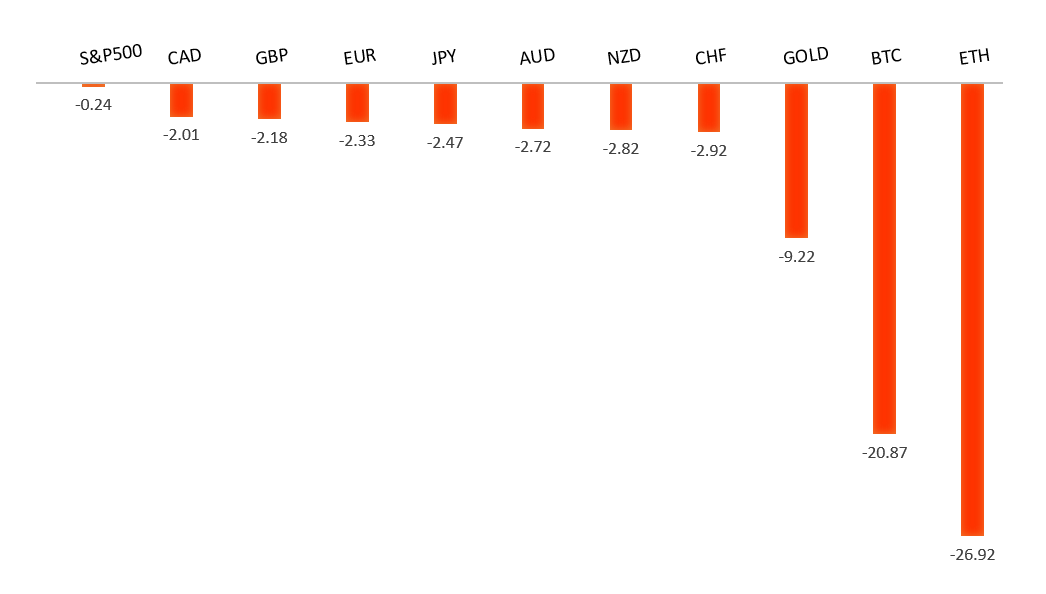
| Markets begin the week balancing escalating Middle East tensions and surging oil prices against a stronger-than-expected US economy, with higher Treasury yields, a firmer dollar, and growing expectations that the Federal Reserve may need to keep policy tighter for longer. | ||
| Performance chart 30day v. USD (%) | ||
 | ||
| Technical & fundamental highlights | ||
| EURUSD: technical overview | ||
| The Euro outlook remains constructive with higher lows sought out on dips in favor of the next major upside extension targeting the 2021 high at 1.2350. Setbacks should be exceptionally well supported ahead of 1.1300. | ||
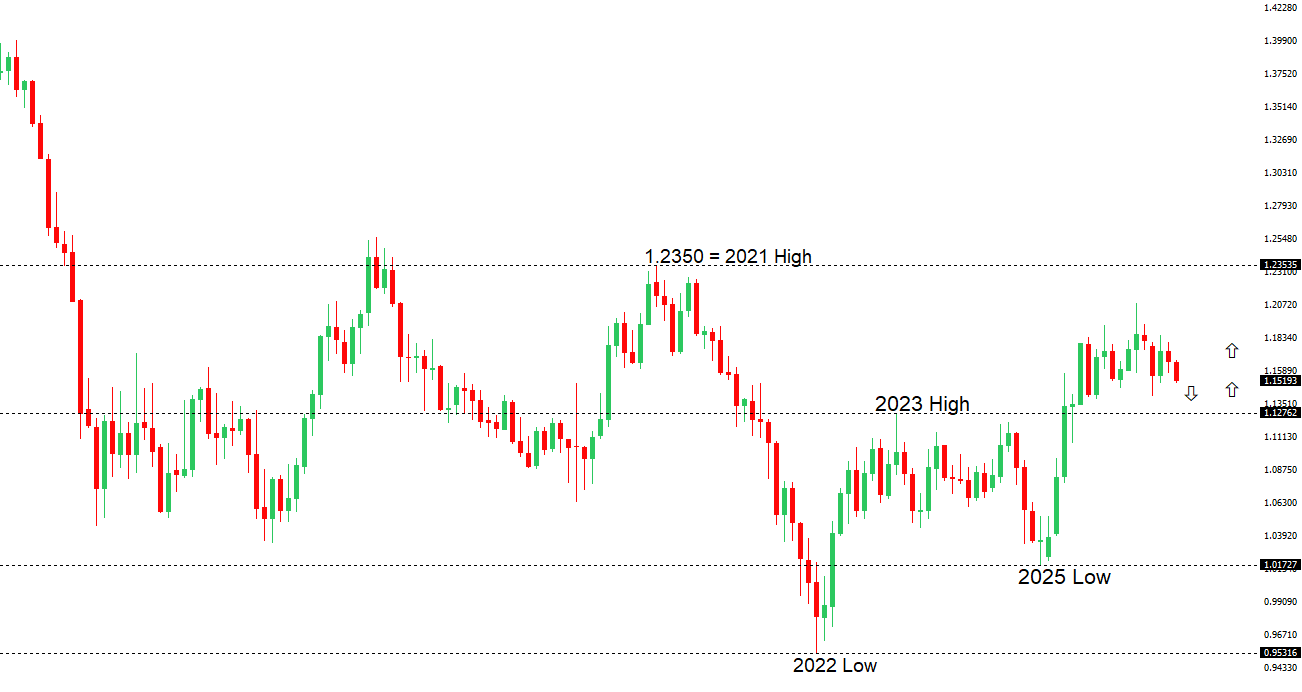 | ||
| R2 1.1646 - 4 June high - Medium R1 1.1576 - 21 May low - Medium S1 1.1504 - 3 April low - Strong S2 1.1443 - 30 March low - Medium | ||
| EURUSD: fundamental overview | ||
| The euro has come under pressure in recent sessions, with EURUSD retreating as a stronger-than-expected US labor market report prompted markets to scale back expectations for Federal Reserve easing and pushed US Treasury yields sharply higher. While Eurozone inflation remains elevated, with headline CPI accelerating to 3.2% in May and underlying price pressures showing signs of broadening, the ECB’s latest rate hike was fully priced and President Lagarde offered little indication of an accelerated tightening path beyond current expectations. At the same time, softer Eurozone growth signals have resurfaced, highlighted by a larger-than-expected 3.8% decline in German factory orders in April, reinforcing concerns over manufacturing momentum in the bloc’s largest economy. More broadly, the euro continues to benefit from improving investor sentiment toward Europe, expectations for increased fiscal spending and defense investment across the region, and a narrowing growth differential versus the US. However, near-term price action remains largely driven by shifts in Fed pricing, US yield dynamics, and broader risk sentiment, with geopolitical tensions in the Middle East adding an additional layer of uncertainty for global markets ahead of this week’s US CPI release and further ECB guidance. | ||
| USDJPY: technical overview | ||
| There are signs of the formation of a meaningful top after the market put in a multi-year high in 2024. At this point, rallies should be well capped above 160.00 in favor of a fresh down-leg back towards the 2024 low at 139.58. Only a monthly close above 160.00 negates. | ||
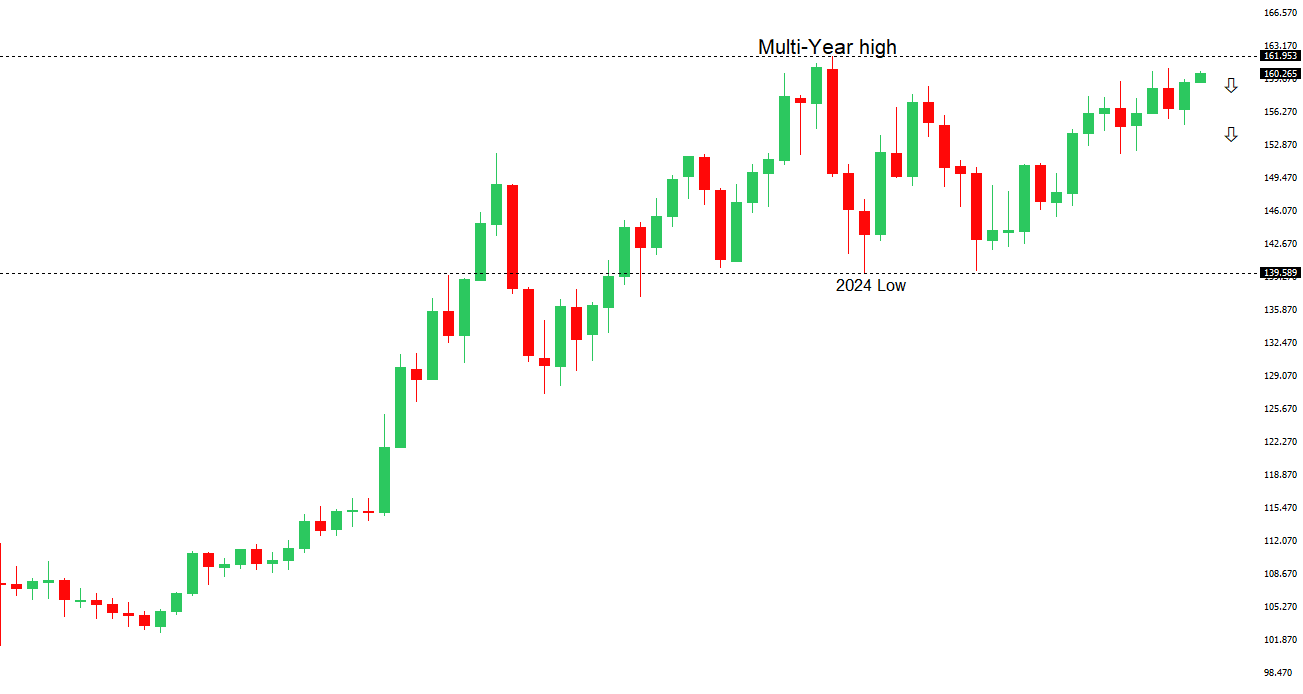 | ||
| R2 160.73 - 30 April/2026 high - Strong R1 160.40 - 8 June high - Strong S1 159.37 - 3 June low - Medium S2 158.59 - 20 May low - Medium | ||
| USDJPY: fundamental overview | ||
| The Japanese Yen remains under pressure, with USDJPY pushing back above the psychologically important 160.00 level, driven primarily by widening US-Japan rate differentials and a resurgence in US Dollar demand. Stronger-than-expected US labor market data, including a solid May nonfarm payrolls report and upward revisions to prior months, have reinforced expectations that the Federal Reserve will keep policy restrictive for longer, supporting higher US Treasury yields. At the same time, rising oil prices amid escalating Israel-Iran tensions have added another headwind for Japan, a major energy importer, worsening the country’s terms of trade and weighing on the Yen. On the domestic side, Japan’s Q1 GDP growth was revised modestly lower, highlighting some loss of economic momentum, although the data has done little to alter expectations for further Bank of Japan normalization. Indeed, stronger wage growth and persistent inflation pressures continue to support expectations for additional BoJ tightening in the months ahead. Nevertheless, for now, external factors remain dominant, with markets focused on the yield advantage of the Dollar and the risk that any sustained move above 160.00 could provoke another round of official intervention, particularly as Japanese authorities have stepped up warnings against excessive currency volatility. | ||
| AUDUSD: technical overview | ||
| There are signs of the formation of a longer-term base with the market recovering out from a meaningful longer-term support zone. The latest monthly close back above 0.7000 takes the big picture pressure off the downside and strengthens the case for a bottom, with the focus now on a push towards 0.8000. Setbacks should now be well supported ahead of 0.6700. | ||
 | ||
| R2 0.7201 - 29 May high - Strong R1 0.7100 - Figure - Medium S1 0.7018 - 8 June low - Medium S2 0.6963 - 8 April low - Strong | ||
| AUDUSD: fundamental overview | ||
| The Australian Dollar has entered a more consolidative phase after its strong rally earlier in the year, with gains increasingly capped by a resilient US Dollar and shifting global risk sentiment. On the domestic front, the currency continues to draw support from the Reserve Bank of Australia’s relatively hawkish stance, as policymakers maintain that inflation remains too elevated and signal that rates are likely to stay restrictive for longer. While recent Australian growth and labor market data have softened at the margin, inflation remains sticky enough to keep markets cautious about pricing in RBA easing. Externally, China – Australia’s largest trading partner – has stabilized rather than accelerated, providing a neutral backdrop for the Aussie through steady, though unspectacular, demand prospects. More recently, however, AUD performance has been dominated by broader macro drivers, including renewed Middle East tensions, which have boosted safe-haven demand for the US Dollar, alongside stronger-than-expected US economic data that has reinforced expectations for a higher-for-longer Federal Reserve policy stance. As a result, the Aussie remains supported by relatively constructive domestic fundamentals and RBA policy expectations, but its upside continues to be constrained by USD strength, geopolitical uncertainty, and the absence of a stronger growth impulse from China. | ||
| Suggested reading | ||
| The AI future we want, M. Murgia, Financial Times (May 31, 2026) Other Nation’s Move To Gold Is Bad News For The Dollar, R. Forsyth, Barron’s (June 6, 2026) | ||