


 | ||
| 30th January 2026 | view in browser | ||
| Markets consolidate as Fed stakes rise | ||
| Markets are consolidating after recent volatility, with the dollar’s modest rebound looking more like a pause than a trend change as risk currencies hold firm and the yen stays resilient. | ||
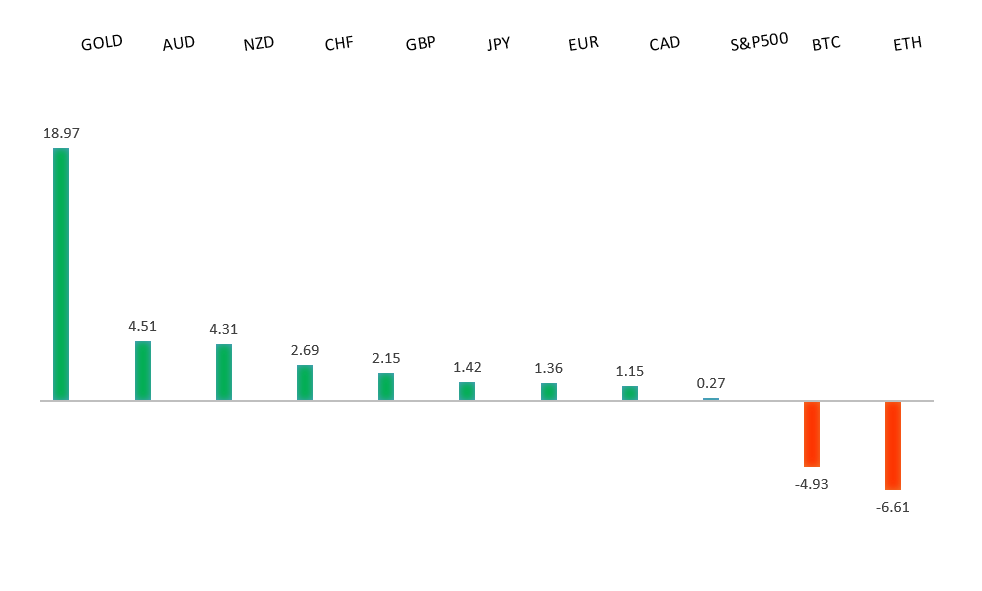
| Performance chart 30day v. USD (%) | ||
 | ||
| Technical & fundamental highlights | ||
| EURUSD: technical overview | ||
| The Euro outlook remains constructive with higher lows sought out on dips in favor of the next major upside extension targeting the 2021 high at 1.2350. Setbacks should be exceptionally well supported ahead of 1.1500. | ||
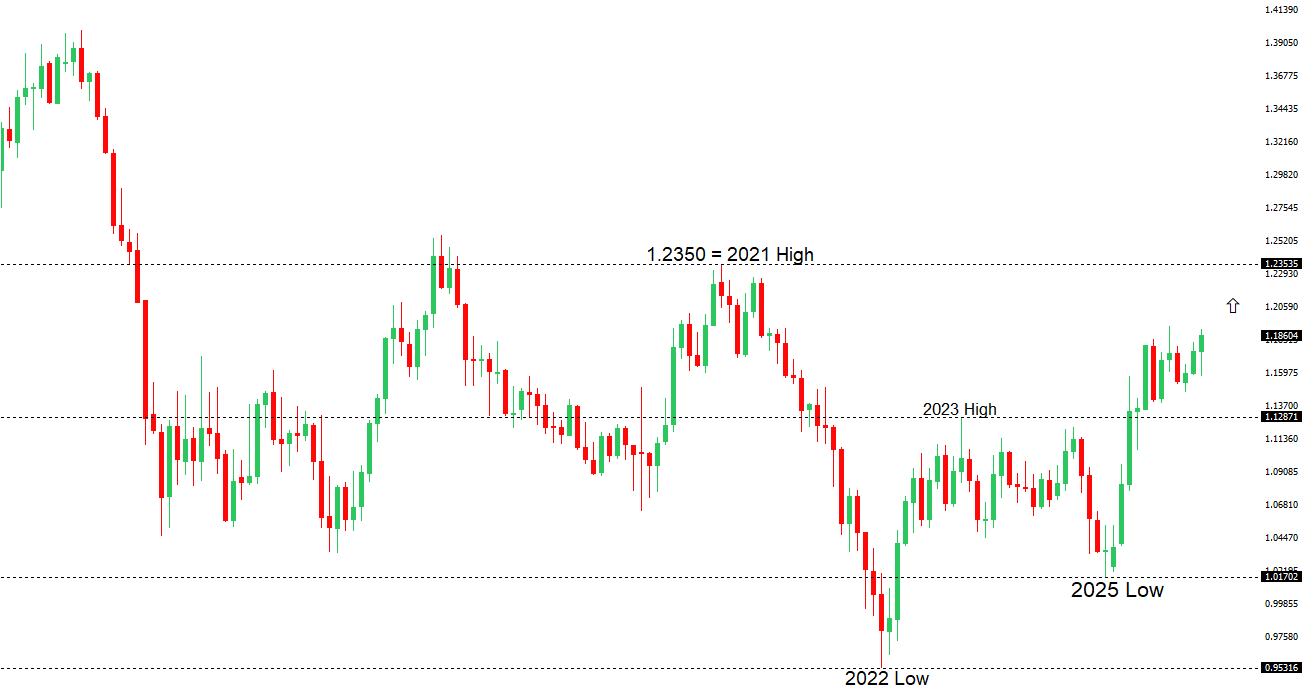 | ||
| R2 1.2100 - Figure -Medium R1 1.2083 - 27 Janaury/2026 high - Strong S1 1.1835 - 26 January low - Medium S2 1.1728 - 23 January low - Medium | ||
| EURUSD: fundamental overview | ||
| The euro slipped in a mild pullback after a strong rally, but remains on course for a second weekly gain as ongoing uncertainty around U.S. policy continues to undermine the dollar and push flows into euro assets. While one major US bank expects the ECB to hold rates in early February, the euro’s sharp rise—now at its strongest since 2021—has revived debate over its disinflationary impact, with some traders even positioning for a surprise cut later in 2026, though most still see policy on hold for now. Recent eurozone surveys show improving business confidence across sectors, pointing to firmer growth momentum into early 2026, even as cautious consumers suggest domestic demand may lag the rebound in corporate sentiment. | ||
| USDJPY: technical overview | ||
| There are signs of a meaningful top in place after the market put in a multi-year high in 2024. At this point, rallies should be well capped ahead of 160.00 in favor of a fresh down-leg back towards the 2024 low at 139.58. The recent break below 154.39 strengthens the outlook. | ||
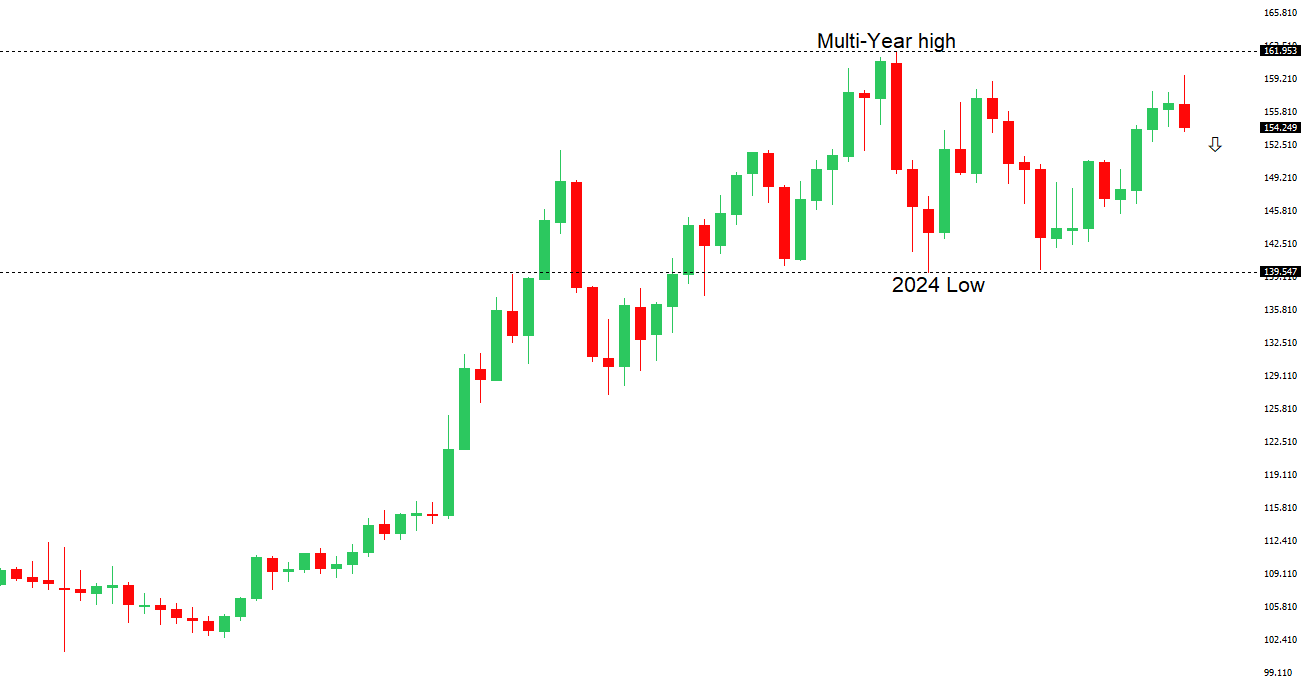 | ||
| R2 155.35 - 26 January high - Medium R1 154.39 - Previous Support - Strong S1 151.97 - 28 January/2026 low - Medium S2 149.38 - 17 October low - Strong | ||
| USDJPY: fundamental overview | ||
| USDJPY remains under pressure into rallies after breaking key technical support as intervention talk continues to weigh on the pair. While memories of last year’s action and recent rate checks have kept markets alert, U.S. officials have ruled out coordinated efforts, and doubts persist over the effectiveness of Japan acting alone. With Japan’s real rates still negative, only modest BOJ tightening expected, and expansionary fiscal risks lingering, the yen remains vulnerable as carry-trade dynamics dominate. Softer Tokyo inflation in January supports the BOJ’s gradual approach, though its slightly hawkish tone leaves open the possibility of another rate hike sooner than expected. | ||
| AUDUSD: technical overview | ||
| There are signs of the potential formation of a longer-term base with the market recovering out from a meaningful longer-term support zone. A monthly close back above 0.7000 will take the big picture pressure off the downside and strengthen case for a bottom. Setbacks should now be well supported ahead of 0.6300. | ||
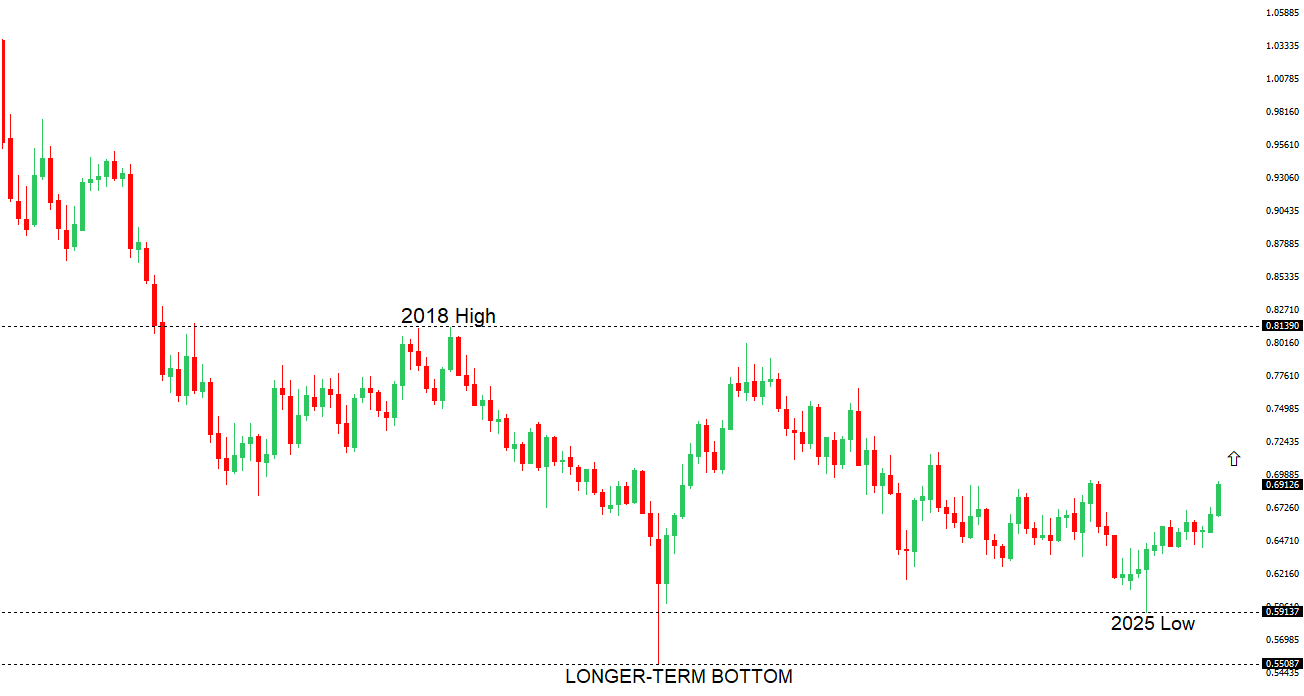 | ||
| R2 0.7158 - 2023 high - Strong R1 0.7095 - 29 January/2026 high - Strong S1 0.6969 - 29 January low - Medium S2 0.6901 - 27 January low - Strong | ||
| AUDUSD: fundamental overview | ||
| The Aussie dollar slipped from a near three-year high, but remains broadly supported as markets now see roughly a 70% chance of an RBA rate hike in early February, up sharply after recent inflation data. While views differ on whether the RBA delivers just one hike or keeps a tightening bias into 2026, policymakers are increasingly seen as among the more hawkish in developed markets, with forecasts likely showing inflation staying above target through next year. At the same time, a softer U.S. dollar backdrop—helped by political signals and a neutral Fed—has eased pressure on high-beta currencies like the AUD. As long as growth holds up and inflation cools only gradually, pullbacks in the Aussie are likely to attract buyers. | ||
| Suggested reading | ||
| What Berkshire’s Greg Abel Should Do With All of That Cash, S. Sears, Barron’s (January 21, 2026) Yale Endowment’s Recent History Illustrates Timeless Truths, Fisher Investments (January 27, 2026) | ||