


 | ||
| 14th January 2026 | view in browser | ||
| Mixed growth, policy in the spotlight | ||
| Global markets start the day mixed, with Europe’s industrial slowdown offset by resilient US demand and Asia leaning on trade and stimulus, as investors focus on key inflation data and central bank signals for the policy path ahead. | ||
| Performance chart 30day v. USD (%) | ||
 | ||
| Technical & fundamental highlights | ||
| EURUSD: technical overview | ||
| The Euro outlook remains constructive with higher lows sought out on dips in favor of the next major upside extension targeting the 2021 high at 1.2350. Setbacks should be exceptionally well supported ahead of 1.1400. | ||
 | ||
| R2 1.1919 - 17 September/2025 high -Strong R1 1.1765 - 2 Janaury/2026 high - Medium S1 1.1618 - 9 January /2026 low - Medium S2 1.1615 - 9 December low - Strong | ||
| EURUSD: fundamental overview | ||
| The Euro has edged up and is likely to grind higher in a choppy, low-volatility environment, with dips supported by the rising 200-day average but upside capped unless fresh US data weakens the dollar. Big banks remain constructive on the euro into 2026, targeting a move above 1.20 as eurozone growth stabilizes and the dollar fades, though January seasonality points to near-term consolidation. Persistent yen weakness and strong carry trades, alongside subdued option volatility, may also limit how aggressively EURUSD can rally for now. | ||
| USDJPY: technical overview | ||
| There are signs of a meaningful top in place after the market put in a multi-year high in 2024. At this point, rallies should be well capped ahead of 160.00 ahead of a fresh down-leg back towards the 2024 low at 139.58. A break below 154.39 will strengthen the outlook. | ||
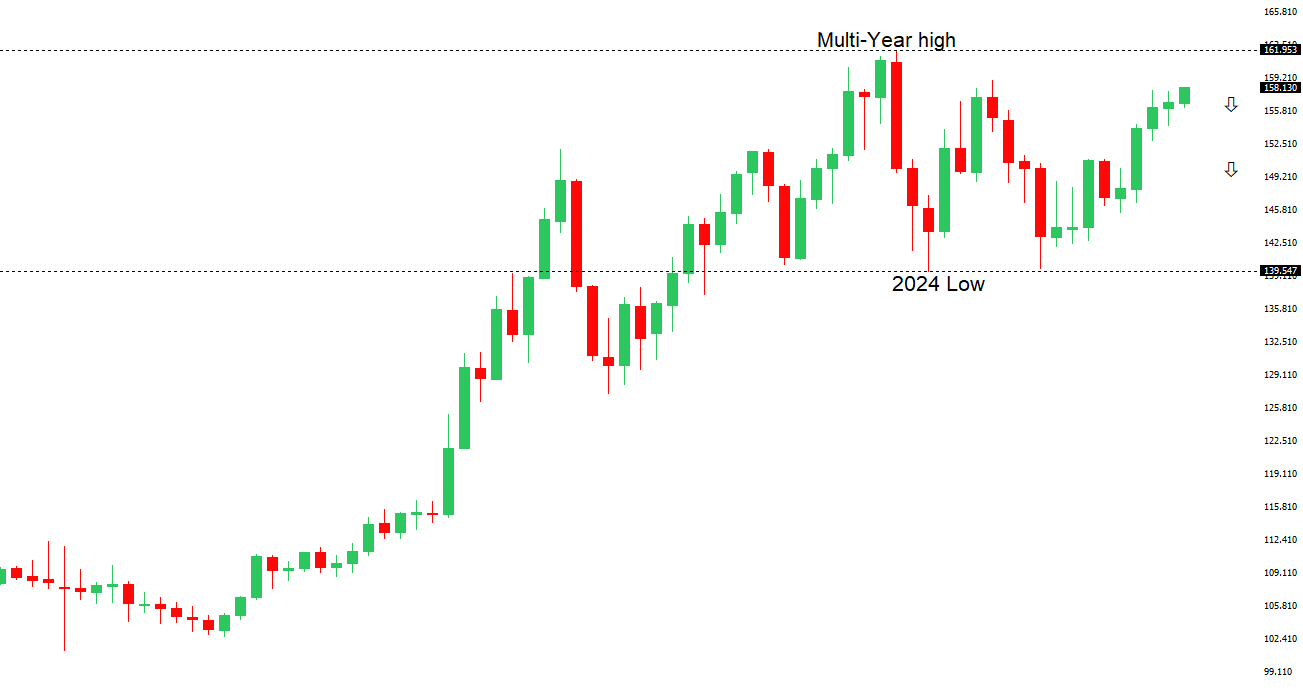 | ||
| R2 160.00 - Psychological - Strong R1 159.46 - 14 January /2026 high - Medium S1 157.52 - 12 January low - Medium S2 156.11 - 5 January/2026 low - Strong | ||
| USDJPY: fundamental overview | ||
| USDJPY is tracking just below 160 with the yen the weakest G10 currency this week, pressured by surging JGB yields near 27-year highs, widening US-Japan yield gaps, and renewed focus on a possible snap election under PM Takaichi that could reinforce reflationary, yen-negative policies. Speculative yen longs have been largely unwound, leaving room for fresh short positioning if USDJPY breaks higher through 160, though rising intervention warnings from Japanese officials add two-way risk. Overall, markets see a heavy yen bias near term, with political headlines and intervention chatter driving volatility. | ||
| AUDUSD: technical overview | ||
| There are signs of the potential formation of a longer-term base with the market trading down into a meaningful longer-term support zone. Only a monthly close below 0.5500 would give reason for rethink. A monthly close back above 0.7000 will take the big picture pressure off the downside and strengthen case for a bottom. | ||
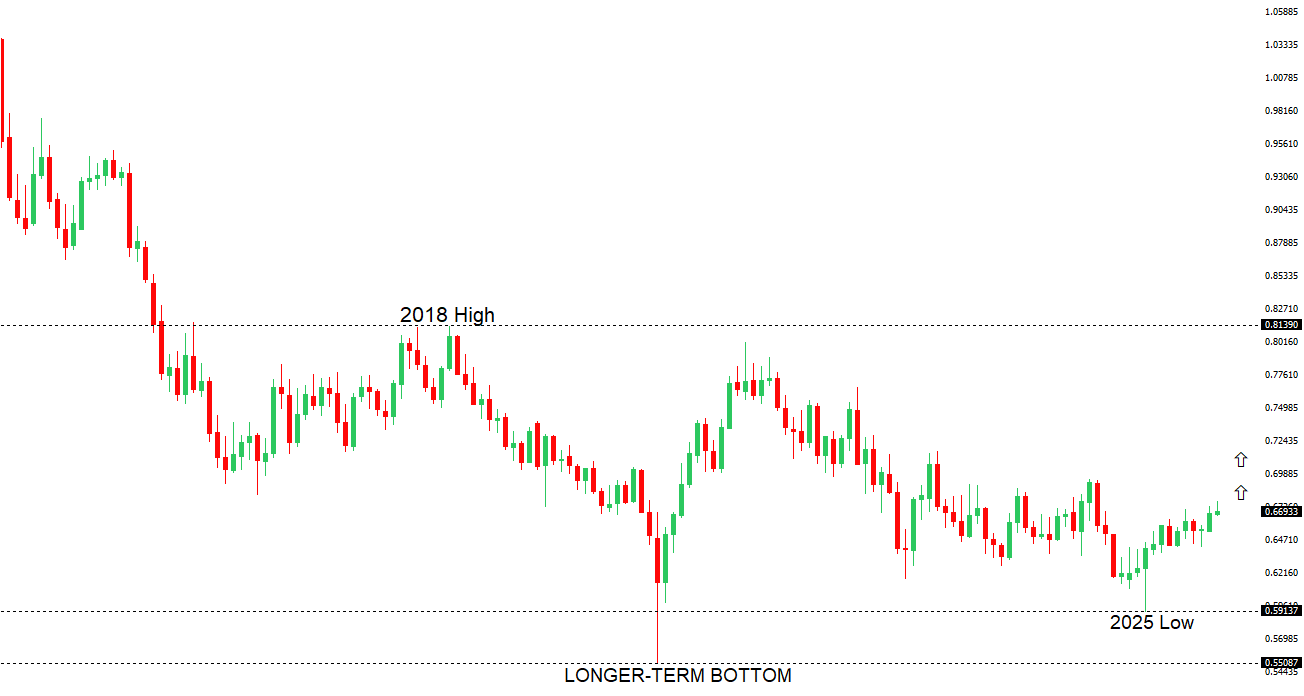 | ||
| R2 0.6800 - Figure - Medium R1 0.6767 - 7 January/2026 high - Medium S1 0.6660 - 31 December low - Medium S2 0.6592 - 18 December low - Strong | ||
| AUDUSD: fundamental overview | ||
| The Aussie dollar is holding comfortably above recent support as rate expectations remain largely unchanged, with markets pricing around a 30–40% chance of an RBA hike by early 2026. Job vacancies were more resilient than expected, while Australian bond yields briefly pushed higher. Policymakers continue to warn inflation is still too high, and Australia’s high G10 yields are seen as supportive for AUD, though upcoming employment and inflation data will be key for February’s RBA decision. Meanwhile, the USD outlook is more balanced as Fed cut expectations depend on data, and rising global political risks could still trigger safe-haven flows that would weigh on the Aussie. | ||
| Suggested reading | ||
| The Economic Debate Becomes More Political, J. Calhoun, Alhambra (January 11, 2026) 2025 Disappointments May Prove a Winner for Crypto, S. McBride, RiskHedge (January 9, 2026) | ||