Day Image
2nd February 2026 | view in browser
Crowded FX trades meet hawkish curveball

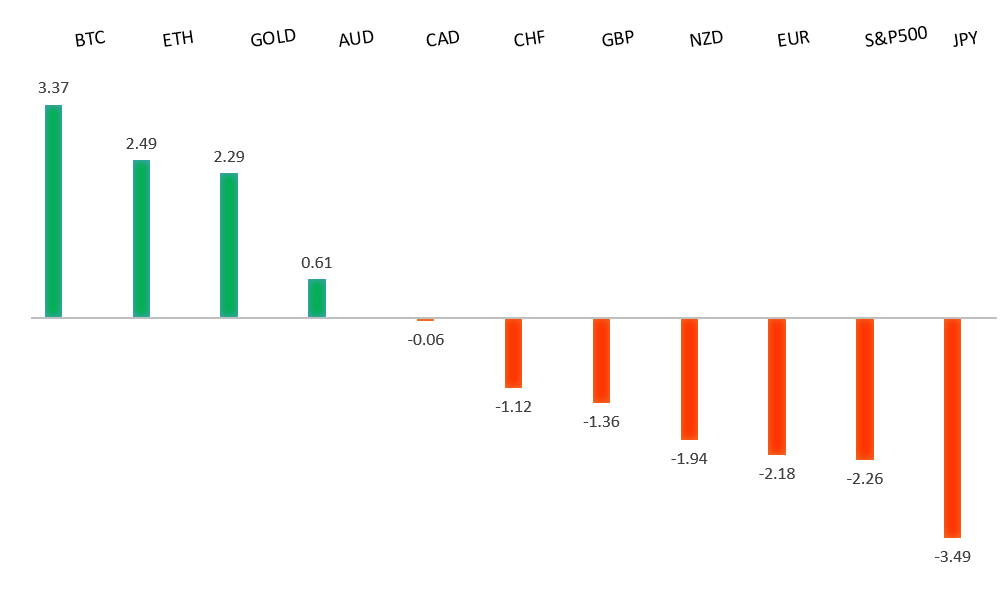
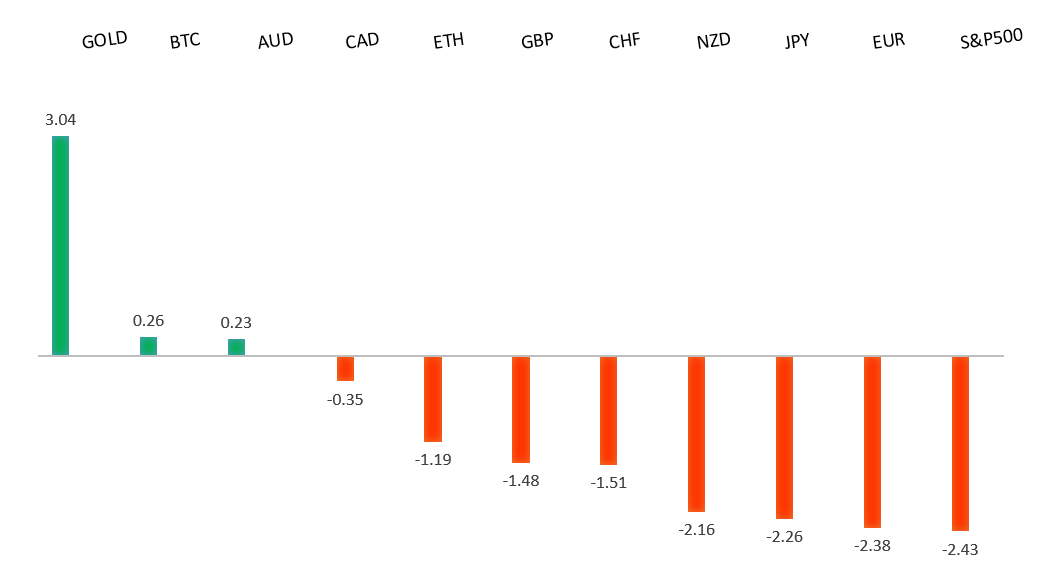
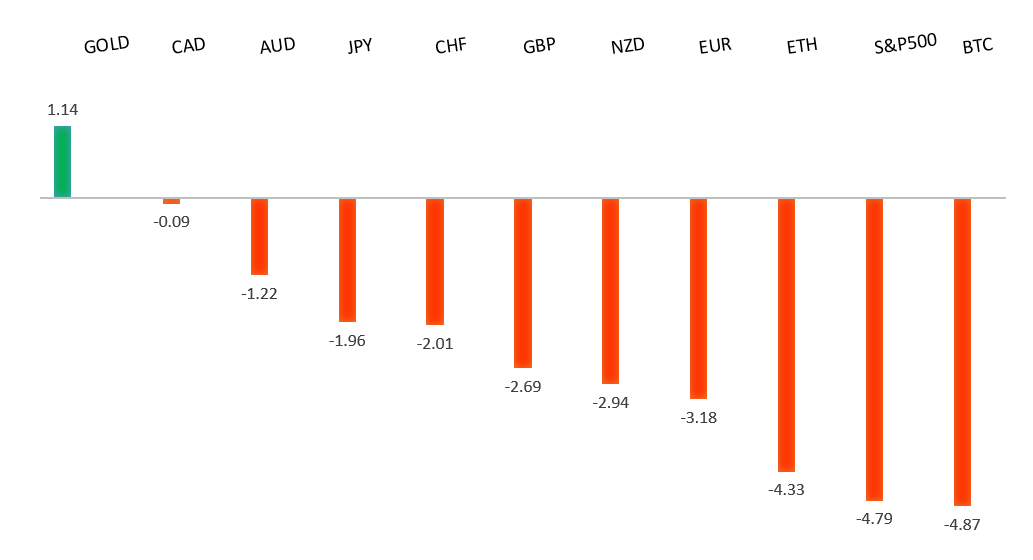
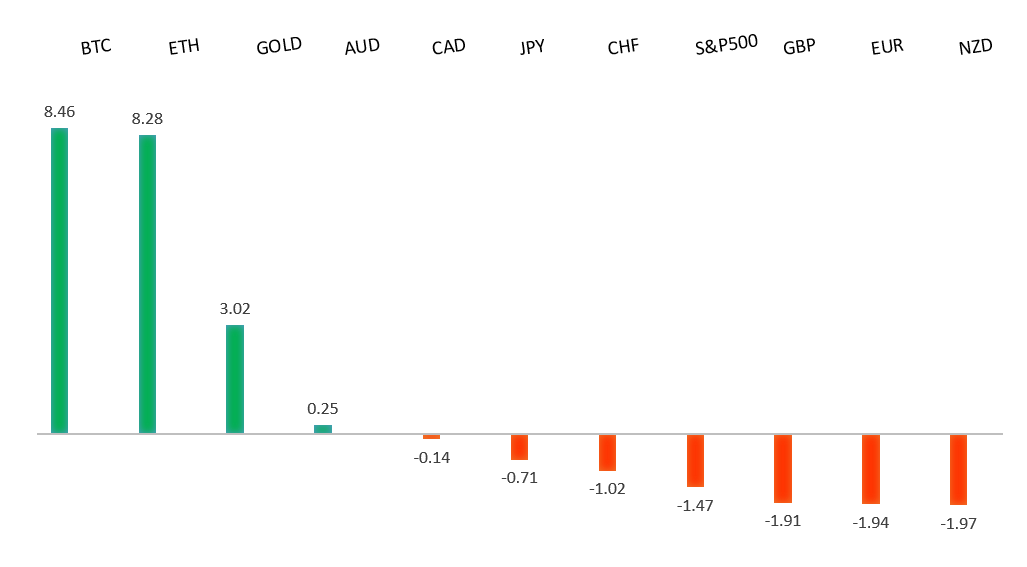
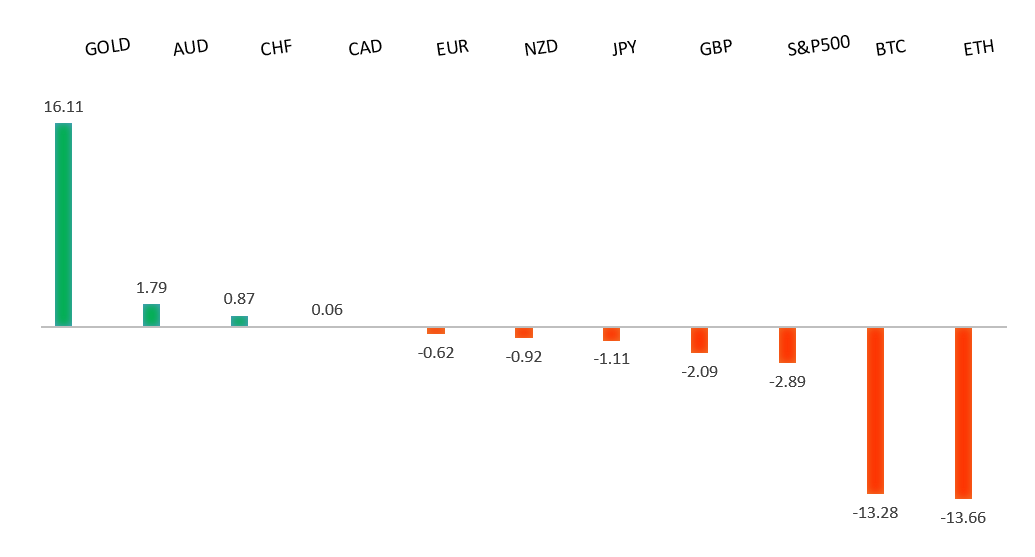
Global markets are consolidating after sharp recent moves, with FX seeing an orderly pullback that still looks more like profit-taking than a true reversal. However, the dollar’s rebound is not purely technical, with demand also supported by Kevin Warsh’s Fed chair nomination.


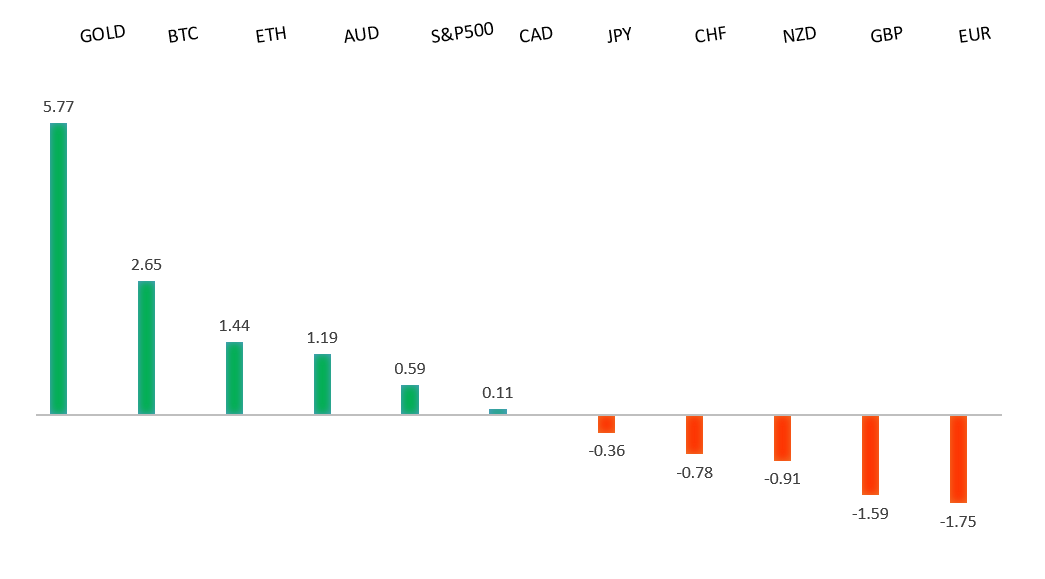
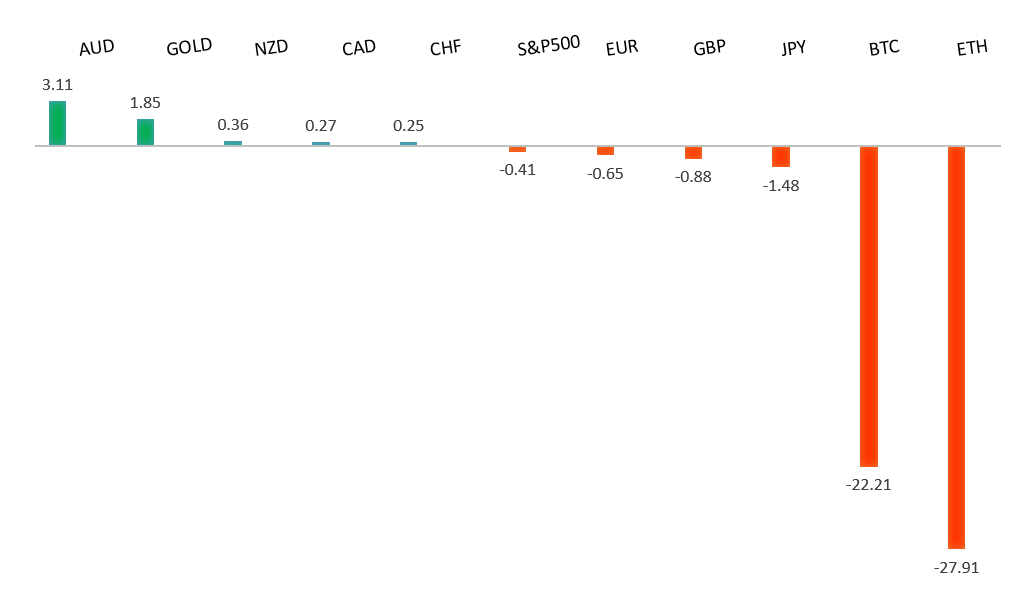
Performance chart 30day v. USD (%)
Performance Chart
 
 
Technical & fundamental highlights
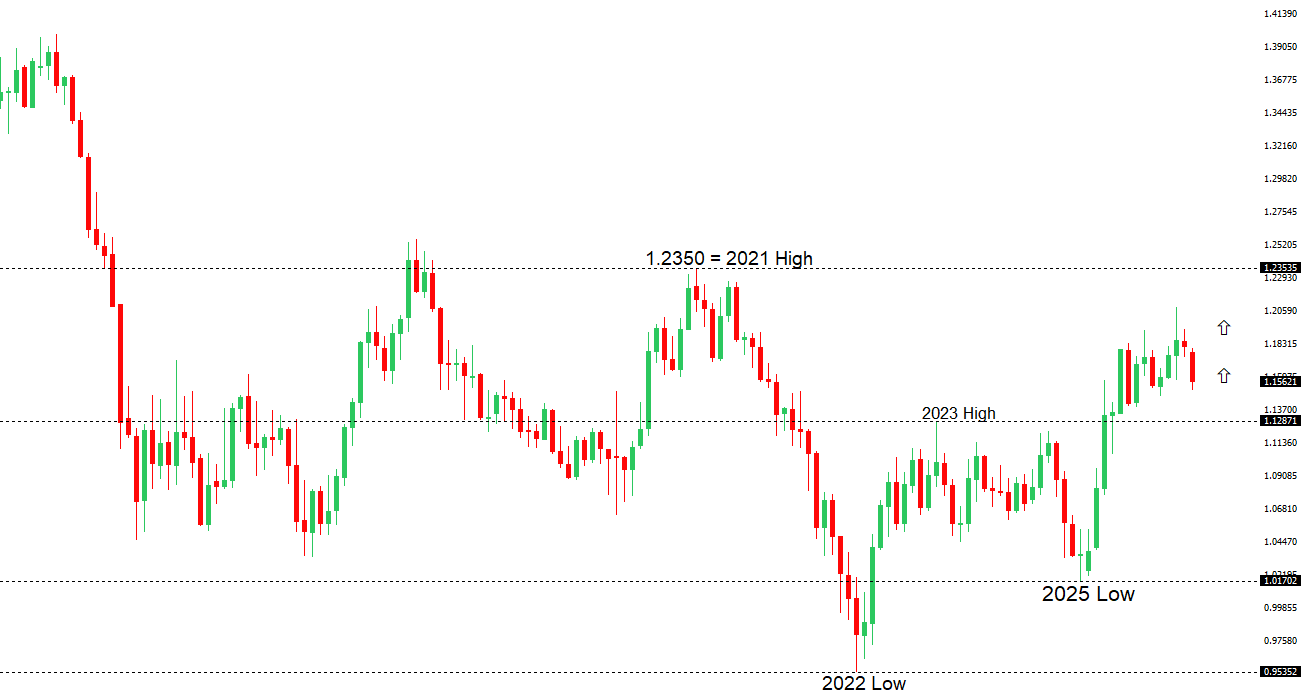
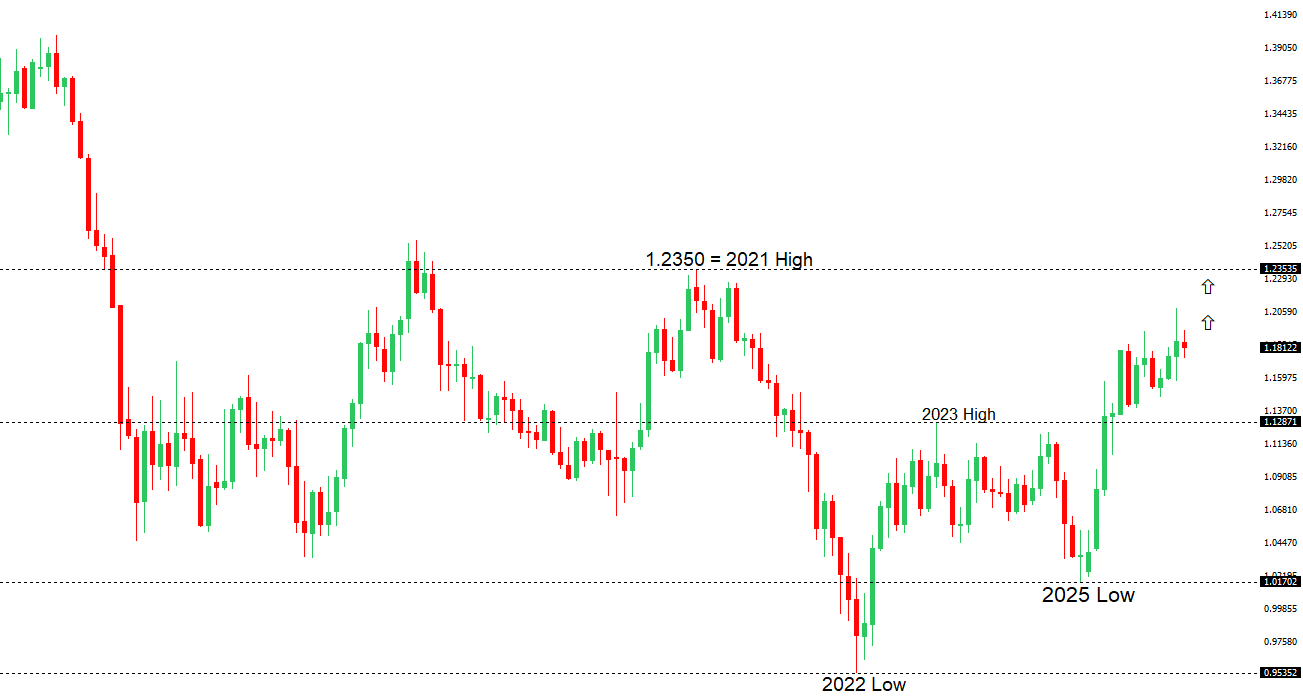
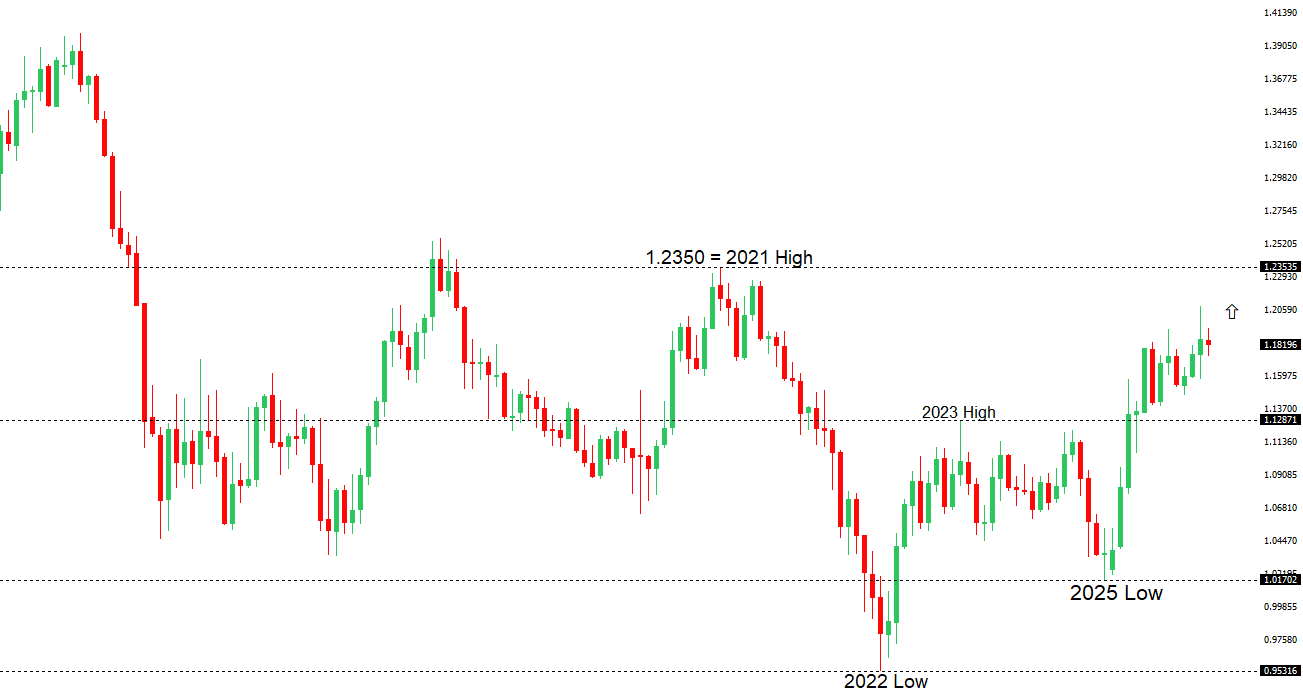
EURUSD: technical overview

The Euro outlook remains constructive with higher lows sought out on dips in favor of the next major upside extension targeting the 2021 high at 1.2350. Setbacks should be exceptionally well supported ahead of 1.1500.

EURUSD Chart
R2 1.2100 - Figure -Medium
R1 1.2083 - 27 Janaury/2026 high - Strong
S1 1.1835 - 26 January low - Medium
S2 1.1728 - 23 January low - Medium
EURUSD: fundamental overview

The euro is modestly higher despite a stronger dollar, supported by resilient euro-area growth and inflation near target. Q4 GDP beat expectations, lifting 2025 growth to 1.5% on solid domestic demand, while inflation expectations remain anchored—reducing the case for near-term ECB easing. Going into this week’s meeting, policymakers are expected to keep rates steady at 2% and signal continuity, with a major dovish shift unlikely unless data weakens materially, even as geopolitical risks and a stronger euro pose headwinds. Markets will also watch PMIs, CPI, and activity data this week for confirmation of the “steady growth, stable inflation, steady ECB” outlook—or signs that easing speculation could return.

 
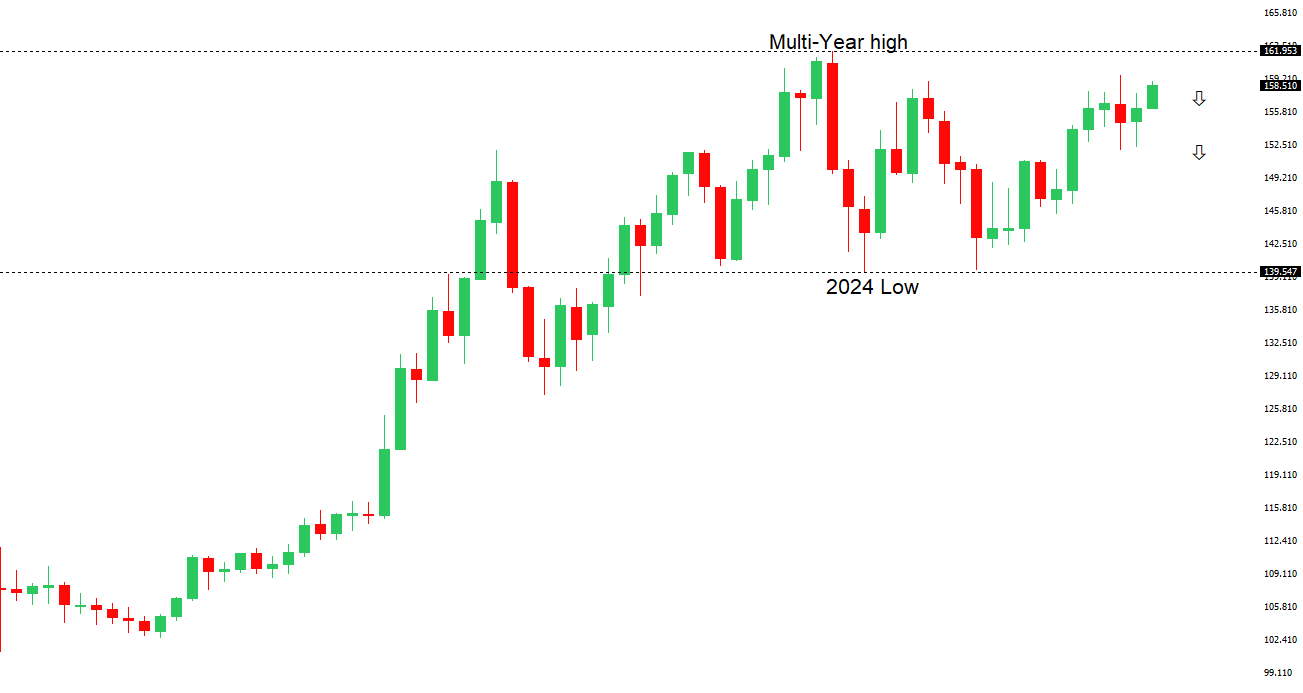
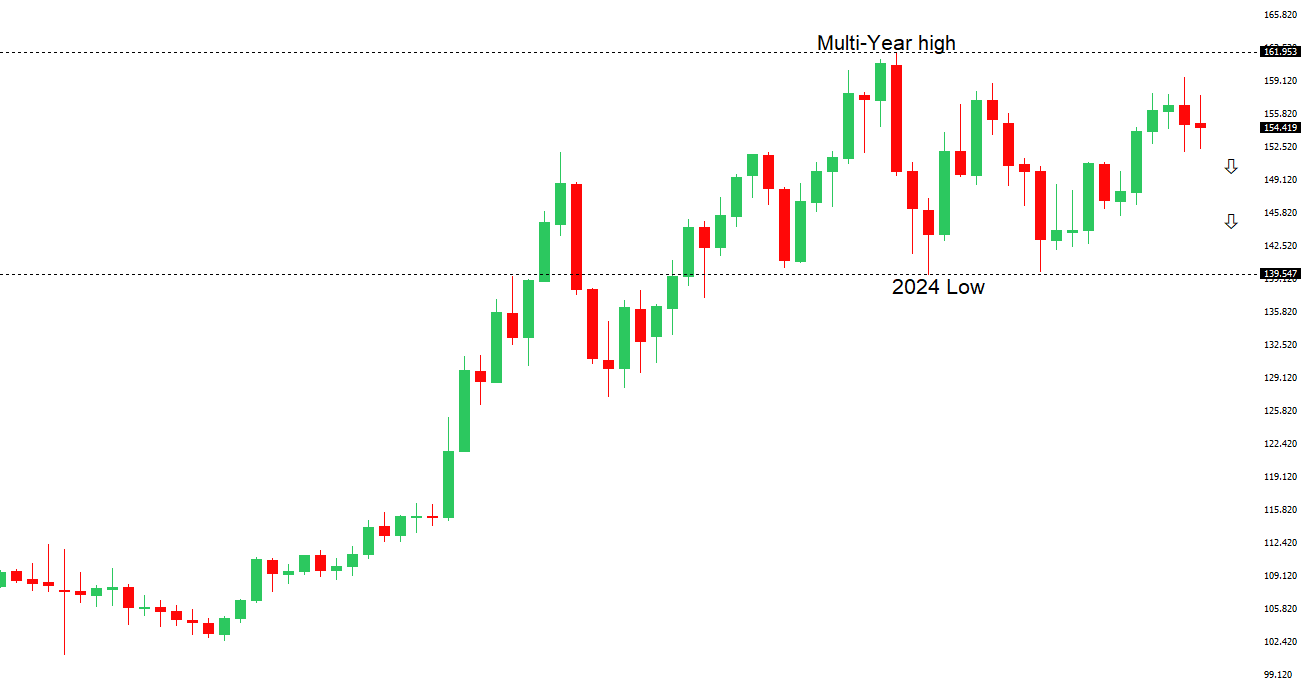
USDJPY: technical overview

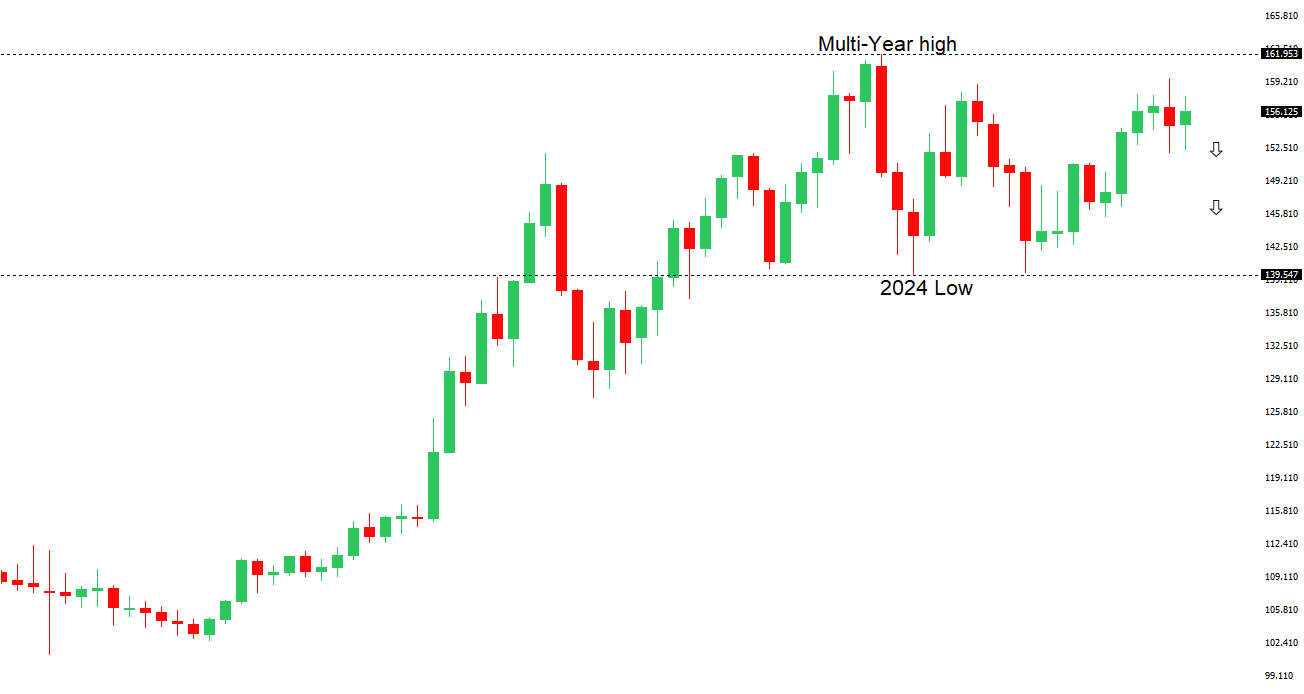
There are signs of a meaningful top in place after the market put in a multi-year high in 2024. At this point, rallies should be well capped ahead of 160.00 in favor of a fresh down-leg back towards the 2024 low at 139.58. The recent break below 154.39 strengthens the outlook.

USDJPY Chart
R2 156.00 - Figure - Medium
R1 155.52 - 2 February high - Medium
S1 151.97 - 28 January/2026 low - Medium
S2 149.38 - 17 October low - Strong
USDJPY: fundamental overview

USDJPY is modestly higher after weekend comments from PM Takaichi were initially taken as reducing near-term intervention risk, while Japan’s January manufacturing PMI offered little support for the yen. Japan has recently leaned on “verbal intervention” and coordination signals with the US to stabilize the currency, but officials admit this approach is fragile—especially if USDJPY heads back toward 160—while soft inflation and consumption data have also pushed back expectations for BOJ hikes. Although the BOJ is laying the groundwork for gradual, data-dependent tightening, rate differentials still favor the dollar, leaving markets unconvinced on sustained yen strength; near term, with positioning cautious ahead of potential intervention and the Feb 8 election, USDJPY is likely to trade sideways with a slight upside bias.

 
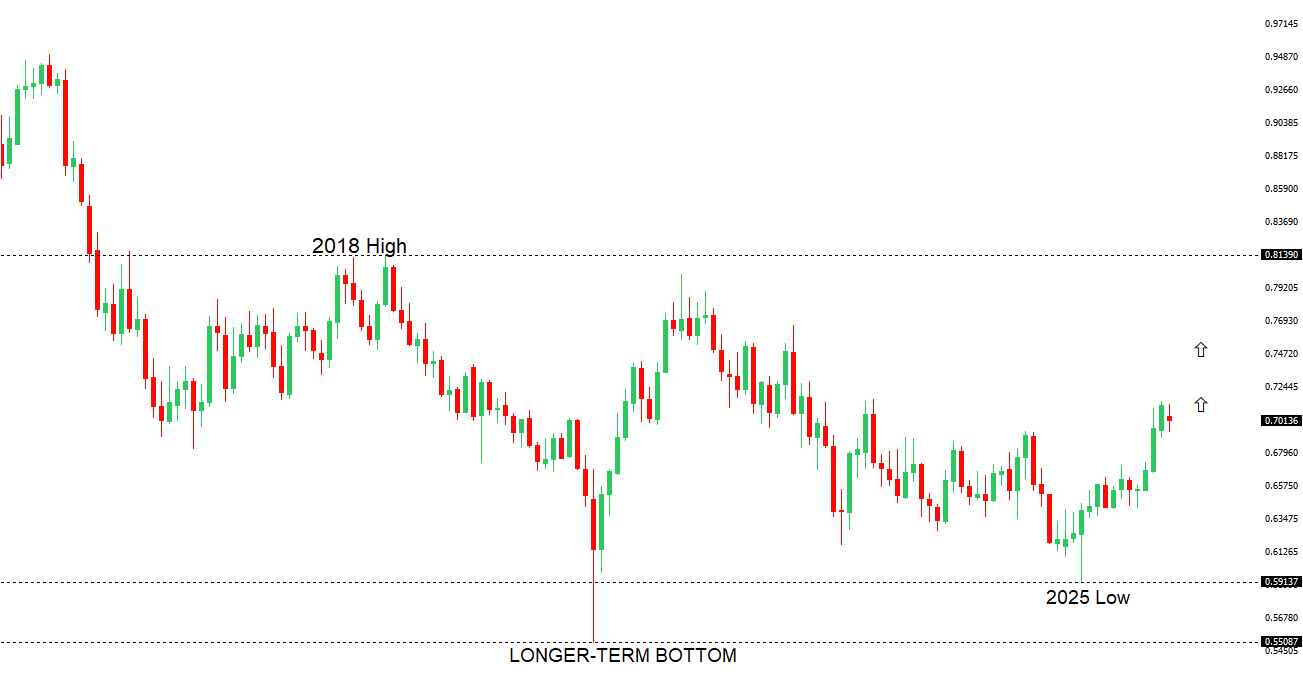
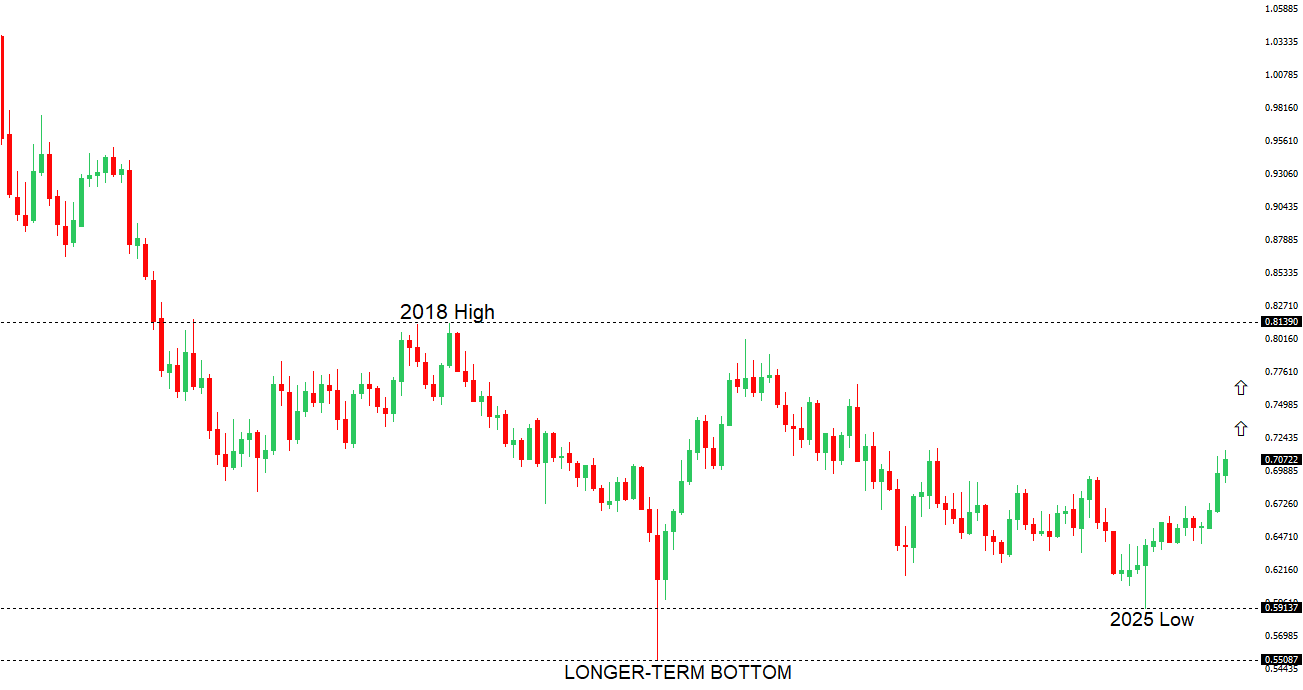
AUDUSD: technical overview

There are signs of the potential formation of a longer-term base with the market recovering out from a meaningful longer-term support zone. A monthly close back above 0.7000 will take the big picture pressure off the downside and strengthen case for a bottom. Setbacks should now be well supported ahead of 0.6300.

AUDUSD Chart
R2 0.7158 - 2023 high - Strong
R1 0.7095 - 29 January/2026 high - Strong
S1 0.6901 - 27 January low - Medium
S2 0.6834 - 23 January low - Medium
AUDUSD: fundamental overview

The Aussie dollar has pulled back, extending last week’s decline and giving back part of January’s strong rally, as a firmer USD and softer gold weighed on the currency. Focus now turns to this week’s RBA meeting, where a likely 25bp hike to 3.85% would keep Australia among the more hawkish G10 central banks, but guidance will be key—signals of a one-off, data-dependent move would leave AUD supported but capped, while talk of further hikes would be a clearer upside trigger. Recent data show cooling monthly inflation but still-elevated annual pressures, alongside tight labor conditions and accelerating home prices driven by supply shortages, reinforcing the case for near-term tightening even as economists expect housing momentum to slow later in 2026 amid affordability and borrowing constraints.

 
Suggested reading

Three Dangers Of The Peter Pan Economy, C. Guo, Soft Currency (January 28, 2026)

Is Diversification Finally Working Again?, B. Carlson, A Wealth of Common Sense (January 27, 2026)


Any opinions, news, research, analyses, prices or other information ("information") contained on this Blog, constitutes marketing communication and it has not been prepared in accordance with legal requirements designed to promote the independence of investment research. Further, the information contained within this Blog does not contain (and should not be construed as containing) investment advice or an investment recommendation, or an offer of, or solicitation for, a transaction in any financial instrument. LMAX Group has not verified the accuracy or basis-in-fact of any claim or statement made by any third parties as comments for every Blog entry.

LMAX Group will not accept liability for any loss or damage, including without limitation to, any loss of profit, which may arise directly or indirectly from use of or reliance on such information. No representation or warranty is given as to the accuracy or completeness of the above information. While the produced information was obtained from sources deemed to be reliable, LMAX Group does not provide any guarantees about the reliability of such sources. Consequently any person acting on it does so entirely at his or her own risk. It is not a place to slander, use unacceptable language or to promote LMAX Group or any other FX and CFD provider and any such postings, excessive or unjust comments and attacks will not be allowed and will be removed from the site immediately.

Day Image
30th January 2026 | view in browser
Markets consolidate as Fed stakes rise

Markets are consolidating after recent volatility, with the dollar’s modest rebound looking more like a pause than a trend change as risk currencies hold firm and the yen stays resilient.


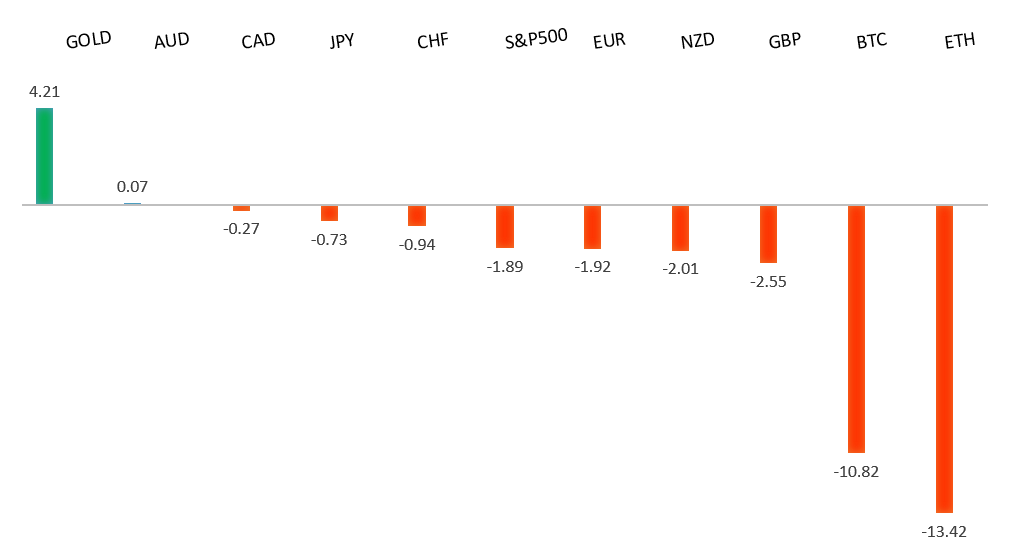
Performance chart 30day v. USD (%)
Performance Chart
 
 
Technical & fundamental highlights
EURUSD: technical overview

The Euro outlook remains constructive with higher lows sought out on dips in favor of the next major upside extension targeting the 2021 high at 1.2350. Setbacks should be exceptionally well supported ahead of 1.1500.

EURUSD Chart
R2 1.2100 - Figure -Medium
R1 1.2083 - 27 Janaury/2026 high - Strong
S1 1.1835 - 26 January low - Medium
S2 1.1728 - 23 January low - Medium
EURUSD: fundamental overview

The euro slipped in a mild pullback after a strong rally, but remains on course for a second weekly gain as ongoing uncertainty around U.S. policy continues to undermine the dollar and push flows into euro assets. While one major US bank expects the ECB to hold rates in early February, the euro’s sharp rise—now at its strongest since 2021—has revived debate over its disinflationary impact, with some traders even positioning for a surprise cut later in 2026, though most still see policy on hold for now. Recent eurozone surveys show improving business confidence across sectors, pointing to firmer growth momentum into early 2026, even as cautious consumers suggest domestic demand may lag the rebound in corporate sentiment.

 
USDJPY: technical overview

There are signs of a meaningful top in place after the market put in a multi-year high in 2024. At this point, rallies should be well capped ahead of 160.00 in favor of a fresh down-leg back towards the 2024 low at 139.58. The recent break below 154.39 strengthens the outlook.

USDJPY Chart
R2 155.35 - 26 January high - Medium
R1 154.39 - Previous Support - Strong
S1 151.97 - 28 January/2026 low - Medium
S2 149.38 - 17 October low - Strong
USDJPY: fundamental overview

USDJPY remains under pressure into rallies after breaking key technical support as intervention talk continues to weigh on the pair. While memories of last year’s action and recent rate checks have kept markets alert, U.S. officials have ruled out coordinated efforts, and doubts persist over the effectiveness of Japan acting alone. With Japan’s real rates still negative, only modest BOJ tightening expected, and expansionary fiscal risks lingering, the yen remains vulnerable as carry-trade dynamics dominate. Softer Tokyo inflation in January supports the BOJ’s gradual approach, though its slightly hawkish tone leaves open the possibility of another rate hike sooner than expected.

 
AUDUSD: technical overview

There are signs of the potential formation of a longer-term base with the market recovering out from a meaningful longer-term support zone. A monthly close back above 0.7000 will take the big picture pressure off the downside and strengthen case for a bottom. Setbacks should now be well supported ahead of 0.6300.

AUDUSD Chart
R2 0.7158 - 2023 high - Strong
R1 0.7095 - 29 January/2026 high - Strong
S1 0.6969 - 29 January low - Medium
S2 0.6901 - 27 January low - Strong
AUDUSD: fundamental overview

The Aussie dollar slipped from a near three-year high, but remains broadly supported as markets now see roughly a 70% chance of an RBA rate hike in early February, up sharply after recent inflation data. While views differ on whether the RBA delivers just one hike or keeps a tightening bias into 2026, policymakers are increasingly seen as among the more hawkish in developed markets, with forecasts likely showing inflation staying above target through next year. At the same time, a softer U.S. dollar backdrop—helped by political signals and a neutral Fed—has eased pressure on high-beta currencies like the AUD. As long as growth holds up and inflation cools only gradually, pullbacks in the Aussie are likely to attract buyers.

 
Suggested reading

What Berkshire’s Greg Abel Should Do With All of That Cash, S. Sears, Barron’s (January 21, 2026)

Yale Endowment’s Recent History Illustrates Timeless Truths, Fisher Investments (January 27, 2026)


Any opinions, news, research, analyses, prices or other information ("information") contained on this Blog, constitutes marketing communication and it has not been prepared in accordance with legal requirements designed to promote the independence of investment research. Further, the information contained within this Blog does not contain (and should not be construed as containing) investment advice or an investment recommendation, or an offer of, or solicitation for, a transaction in any financial instrument. LMAX Group has not verified the accuracy or basis-in-fact of any claim or statement made by any third parties as comments for every Blog entry.

LMAX Group will not accept liability for any loss or damage, including without limitation to, any loss of profit, which may arise directly or indirectly from use of or reliance on such information. No representation or warranty is given as to the accuracy or completeness of the above information. While the produced information was obtained from sources deemed to be reliable, LMAX Group does not provide any guarantees about the reliability of such sources. Consequently any person acting on it does so entirely at his or her own risk. It is not a place to slander, use unacceptable language or to promote LMAX Group or any other FX and CFD provider and any such postings, excessive or unjust comments and attacks will not be allowed and will be removed from the site immediately.

Day Image
29th January 2026 | view in browser
Fed on hold, gold flies, FX reversals build

Global markets kick off the day with a strong risk and reflation tone following the Fed’s decision to hold rates steady, which reinforced expectations for a near-term pause and helped pressure the dollar.


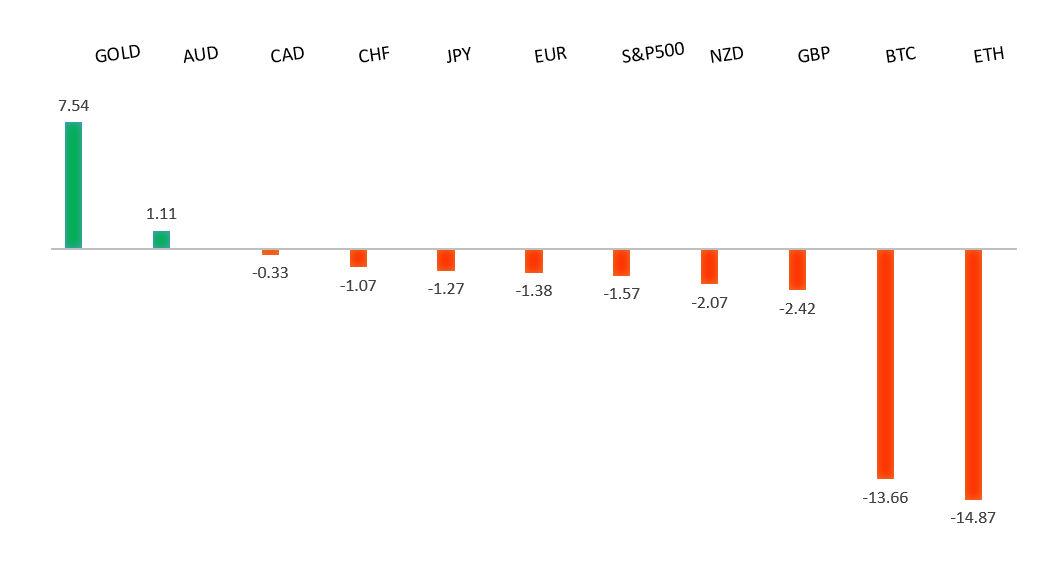
Performance chart 30day v. USD (%)
Performance Chart
 
 
Technical & fundamental highlights
EURUSD: technical overview

The Euro outlook remains constructive with higher lows sought out on dips in favor of the next major upside extension targeting the 2021 high at 1.2350. Setbacks should be exceptionally well supported ahead of 1.1500.

EURUSD Chart
R2 1.2100 - Figure -Medium
R1 1.2083 - 27 Janaury/2026 high - Strong
S1 1.1835 - 26 January low - Medium
S2 1.1728 - 23 January low - Medium
EURUSD: fundamental overview

The Euro edged up, sitting just below the key 1.20 level as broad dollar weakness continues to drive a shift out of USD and into the euro, with investors increasingly uneasy about U.S. political and policy risks. While Washington appears comfortable with a softer dollar, and talk of a “strong dollar policy” is unlikely to reverse the trend, further euro gains may meet resistance from ECB officials, who are already warning that a stronger currency could damp inflation and exports and push policy in a more dovish direction. Meanwhile, Germany’s latest consumer confidence data showed a modest improvement, suggesting tentative stabilization in demand, but conditions remain weak—leaving euro strength as a continued headwind and reinforcing the ECB’s cautious stance.

 
USDJPY: technical overview

There are signs of a meaningful top in place after the market put in a multi-year high in 2024. At this point, rallies should be well capped ahead of 160.00 in favor of a fresh down-leg back towards the 2024 low at 139.58. The recent break below 154.39 strengthens the outlook.

USDJPY Chart
R2 155.35 - 26 January high - Medium
R1 154.39 - Previous Support - Strong
S1 151.97 - 28 January/2026 low - Medium
S2 149.38 - 17 October low - Strong
USDJPY: fundamental overview

The yen remains under pressure as U.S. officials dismissed intervention talk and Japan’s domestic political uncertainty ahead of the Feb. 8 snap election continues to weigh. While BOJ minutes hint at possible further rate hikes by April as yen weakness feeds inflation—helping stabilize yields—fiscal concerns and election risks limit confidence in sustained yen strength. Overall, intervention could drive a short-term move toward 145–146, but without stronger policy follow-through, any yen gains are likely to prove temporary.

 
AUDUSD: technical overview

There are signs of the potential formation of a longer-term base with the market recovering out from a meaningful longer-term support zone. A monthly close back above 0.7000 will take the big picture pressure off the downside and strengthen case for a bottom. Setbacks should now be well supported ahead of 0.6300.

AUDUSD Chart
R2 0.7158 - 2023 high - Strong
R1 0.7095 - 29 January/2026 high - Strong
S1 0.6977 - 28 January low - Medium
S2 0.6901 - 27 January low - Strong
AUDUSD: fundamental overview

The Australian dollar climbed to its highest level since February 2023, remaining the top-performing G10 currency this year as markets price in a more hawkish RBA. Stronger export prices and firmer Q4 inflation—especially a five-quarter high in core measures—have lifted expectations for at least one more 25bp rate hike, with futures now assigning roughly a 68% chance of a February move, though some see parts of the inflation pickup as temporary. Major banks still lean toward a hike, while a softer US dollar backdrop has added support for AUD. Overall, the RBA is viewed as one of the more hawkish developed-market central banks near term, keeping the bias toward buying dips as long as growth holds up and inflation cools only gradually.

 
Suggested reading

India and the true cost of coal, K. Deep Singh, Financial Times (January 29, 2026)

Beneath a $5,000 Milestone Are Gold’s Drawbacks, Fisher Investments (January 26, 2026)


Any opinions, news, research, analyses, prices or other information ("information") contained on this Blog, constitutes marketing communication and it has not been prepared in accordance with legal requirements designed to promote the independence of investment research. Further, the information contained within this Blog does not contain (and should not be construed as containing) investment advice or an investment recommendation, or an offer of, or solicitation for, a transaction in any financial instrument. LMAX Group has not verified the accuracy or basis-in-fact of any claim or statement made by any third parties as comments for every Blog entry.

LMAX Group will not accept liability for any loss or damage, including without limitation to, any loss of profit, which may arise directly or indirectly from use of or reliance on such information. No representation or warranty is given as to the accuracy or completeness of the above information. While the produced information was obtained from sources deemed to be reliable, LMAX Group does not provide any guarantees about the reliability of such sources. Consequently any person acting on it does so entirely at his or her own risk. It is not a place to slander, use unacceptable language or to promote LMAX Group or any other FX and CFD provider and any such postings, excessive or unjust comments and attacks will not be allowed and will be removed from the site immediately.

Day Image
28th January 2026 | view in browser
Macro shifts into a new gear

Global markets are entering a new macro regime marked by broad US dollar weakness, diverging central bank paths led by a steadier Fed and increasingly hawkish APAC, improving global growth momentum, and resilient commodity currencies—creating a more supportive backdrop for risk assets while FX becomes the primary transmission channel for policy shifts.


Performance chart 30day v. USD (%)
Performance Chart
 
 
Technical & fundamental highlights
EURUSD: technical overview

The Euro outlook remains constructive with higher lows sought out on dips in favor of the next major upside extension targeting the 2021 high at 1.2350. Setbacks should be exceptionally well supported ahead of 1.1500.

EURUSD Chart
R2 1.2100 - Figure -Medium
R1 1.2083 - 27 Janaury/2026 high - Strong
S1 1.1835 - 26 January low - Medium
S2 1.1728 - 23 January low - Medium
EURUSD: fundamental overview

The Euro has surged to the low-1.20s, reaching multi-year highs after fully reversing its late-2025 decline, as investors grow uneasy over unpredictable US policy and increasingly view euro assets as a safer, liquid alternative to unhedged dollar exposure—helped by signals from Trump that appear tolerant of a weaker dollar. However, with the Fed decision due and EURUSD now above 1.20, upside momentum may face resistance, especially as the ECB has warned that excessive euro strength could hurt exports and inflation, potentially reviving expectations for rate cuts despite policymakers saying rates are currently in a “good place.”

 
USDJPY: technical overview

There are signs of a meaningful top in place after the market put in a multi-year high in 2024. At this point, rallies should be well capped ahead of 160.00 in favor of a fresh down-leg back towards the 2024 low at 139.58. The recent break below 154.39 strengthens the outlook.

USDJPY Chart
R2 155.35 - 26 January high - Medium
R1 154.39 - Previous Support - Strong
S1 151.97 - 28 January/2026 low - Medium
S2 149.38 - 17 October low - Strong
USDJPY: fundamental overview

USDJPY rebounded modestly to around 152.75 after a sharp 4% slide, but the broader tone remains fragile as intervention risks, policy coordination talk, and technical damage continue to cap rallies. In Japan, improving inflation and wage expectations are fueling speculation that major pension funds could modestly shift back into JGBs, supporting a potential “repatriation” theme for both bonds and the yen, though any large reallocation looks unlikely. Still, wide rate differentials keep the yen under pressure, while a break below key technical levels leaves USDJPY biased lower, with joint U.S.–Japan intervention potentially opening the door toward 145–150. Near term, attention turns to the 40-year JGB auction, while stronger global growth could revive dollar carry demand and complicate the outlook.

 
AUDUSD: technical overview

There are signs of the potential formation of a longer-term base with the market trading down into a meaningful longer-term support zone. A monthly close back above 0.7000 will take the big picture pressure off the downside and strengthen case for a bottom. Setbacks should now be well supported ahead of 0.6300.

AUDUSD Chart
R2 0.7100 - Figure - Medium
R1 0.7023 - 28 January/2026 high - Strong
S1 0.6901 - 27 January low - Strong
S2 0.6834 - 23 January low - Medium
AUDUSD: fundamental overview

The Aussie dollar has slipped after briefly hitting a near three-year high on strong December CPI data, which lifted expectations for an RBA rate hike. Markets now see roughly a 70% chance of a 25bp hike in February, up from 55% earlier this week, and any pullbacks are likely to attract buyers. External conditions also favor the AUD, with US political uncertainty weighing on the dollar, while improving Chinese industrial profits and solid Australian business confidence reinforce the case for a hawkish RBA and provide ongoing support for the currency.

 
Suggested reading

Gold v. S&P: Most Interesting Chart In Finance, J. Calhoun, Alhambra Investments (January 25, 2026)

My #1, Slam Dunk, Artificial Intelligence Trade In 2026, S. McBride, RiskHedge (January 26, 2026)


Any opinions, news, research, analyses, prices or other information ("information") contained on this Blog, constitutes marketing communication and it has not been prepared in accordance with legal requirements designed to promote the independence of investment research. Further, the information contained within this Blog does not contain (and should not be construed as containing) investment advice or an investment recommendation, or an offer of, or solicitation for, a transaction in any financial instrument. LMAX Group has not verified the accuracy or basis-in-fact of any claim or statement made by any third parties as comments for every Blog entry.

LMAX Group will not accept liability for any loss or damage, including without limitation to, any loss of profit, which may arise directly or indirectly from use of or reliance on such information. No representation or warranty is given as to the accuracy or completeness of the above information. While the produced information was obtained from sources deemed to be reliable, LMAX Group does not provide any guarantees about the reliability of such sources. Consequently any person acting on it does so entirely at his or her own risk. It is not a place to slander, use unacceptable language or to promote LMAX Group or any other FX and CFD provider and any such postings, excessive or unjust comments and attacks will not be allowed and will be removed from the site immediately.

Day Image
27th January 2026 | view in browser
Dollar steadies as trade risks resurface

Markets are steady with the dollar staging a modest rebound and equities leaning higher, as investors weigh near-term yen dynamics and key U.S. data against renewed tariff threats from Washington and signs of improving global trade ties via a potential EU–India deal.


Performance chart 30day v. USD (%)
Performance Chart
 
 
Technical & fundamental highlights
EURUSD: technical overview

The Euro outlook remains constructive with higher lows sought out on dips in favor of the next major upside extension targeting the 2021 high at 1.2350. Setbacks should be exceptionally well supported ahead of 1.1500.

EURUSD Chart
R2 1.1919 - 17 September/2025 high -Strong
R1 1.1907 - 26 Janaury/2026 high - Medium
S1 1.1769 - 20 January high - Medium
S2 1.1728 - 23 January low - Medium
EURUSD: fundamental overview

The Euro is holding modest gains this year and has rebuilt bullish momentum as a softer dollar and rising concern over erratic U.S. policy push investors toward euro assets as a liquid, relatively safe alternative. Talk of possible U.S.–Japan intervention to curb dollar strength adds to this shift, though a move toward 1.20 could test ECB tolerance and revive rate-cut expectations. Meanwhile, Germany’s Ifo index highlights a still-weak economic backdrop despite early signs of recovery, with confidence dented by tariff uncertainty and slow stimulus rollout—leaving the euro supported in the near term by FX dynamics, but its medium-term growth outlook fragile without deeper structural reforms.

 
USDJPY: technical overview

There are signs of a meaningful top in place after the market put in a multi-year high in 2024. At this point, rallies should be well capped ahead of 160.00 in favor of a fresh down-leg back towards the 2024 low at 139.58. The recent break below 154.39 strengthens the outlook.

USDJPY Chart
R2 156.00 - Figure - Medium
R1 155.35 - 26 January high - Medium
S1 153.30 - 26 January/2026 low - Medium
S2 152.82 - 7 November low - Medium
USDJPY: fundamental overview

USDJPY has edged higher but remains near recent lows as mounting intervention risk caps upside, following rare rate checks by both Tokyo and the New York Fed and increasingly forceful warnings from Japanese officials. Last Friday’s sharp yen rally—its biggest since August—broke key support and revived talk of possible, even coordinated, US-Japan action, echoing past episodes that preceded intervention near 160. Traders now see the high-150s as a psychological ceiling, with history suggesting any yen-buying move could knock USDJPY 2–4% lower on the day (and up to ~5% in aggressive cases), pointing to a potential downside zone around 145–150  if coordination materializes, though officials say intervention would only come in response to excessive volatility and there’s still no clear evidence it has begun.

 
AUDUSD: technical overview

There are signs of the potential formation of a longer-term base with the market trading down into a meaningful longer-term support zone. A monthly close back above 0.7000 will take the big picture pressure off the downside and strengthen case for a bottom. Setbacks should now be well supported ahead of 0.6300.

AUDUSD Chart
R2 0.7000 - Psychological - Strong
R1 0.6942 - 30 September/2025 high - Strong
S1 0.6834 - 23 January low - Medium
S2 0.6767 - 7 January high - Medium
AUDUSD: fundamental overview

The Aussie eased slightly after a strong run, now up 3.6% YTD and about 10% YoY, with domestic data continuing to underpin the currency. A blowout December jobs report and improving business confidence have lifted three-year yields and boosted expectations for a February RBA hike, positioning the AUD as a relative rate-differential winner in G10 as markets increasingly see the RBA staying hawkish into 2026, even as the Fed is expected to ease later this year. Attention now turns to Wednesday’s CPI, with unofficial data pointing to firm inflation in the mid-3s—above the RBA’s target—keeping risks tilted toward an early, modest tightening, though many analysts doubt inflation will be strong enough to force a February move. Positioning remains supportive, with speculators still net short AUD but steadily covering since December.

 
Suggested reading

Growing Trade War Fears Remain Unsubstantiated, Fisher Investments (January 24, 2026)

Why Aren’t Bond Yields Falling?, M. Rzepczynski, Disciplined Global Macro (January 22, 2026)


Any opinions, news, research, analyses, prices or other information ("information") contained on this Blog, constitutes marketing communication and it has not been prepared in accordance with legal requirements designed to promote the independence of investment research. Further, the information contained within this Blog does not contain (and should not be construed as containing) investment advice or an investment recommendation, or an offer of, or solicitation for, a transaction in any financial instrument. LMAX Group has not verified the accuracy or basis-in-fact of any claim or statement made by any third parties as comments for every Blog entry.

LMAX Group will not accept liability for any loss or damage, including without limitation to, any loss of profit, which may arise directly or indirectly from use of or reliance on such information. No representation or warranty is given as to the accuracy or completeness of the above information. While the produced information was obtained from sources deemed to be reliable, LMAX Group does not provide any guarantees about the reliability of such sources. Consequently any person acting on it does so entirely at his or her own risk. It is not a place to slander, use unacceptable language or to promote LMAX Group or any other FX and CFD provider and any such postings, excessive or unjust comments and attacks will not be allowed and will be removed from the site immediately.

Day Image
26th January 2026 | view in browser
FX volatility sets the tone

Markets kick off the week with broad USD weakness led by a sharp USD/JPY drop on renewed Japan intervention risks, lifting the euro toward 1.20, driving gold to fresh records, easing US yields, and leaving equities softer as investors weigh key data, ECB signals, and rising US political and trade uncertainties.


Performance chart 30day v. USD (%)
Performance Chart
 
 
Technical & fundamental highlights
EURUSD: technical overview

The Euro outlook remains constructive with higher lows sought out on dips in favor of the next major upside extension targeting the 2021 high at 1.2350. Setbacks should be exceptionally well supported ahead of 1.1500.

EURUSD Chart
R2 1.1919 - 17 September/2025 high -Strong
R1 1.1898 - 26 Janaury/2026 high - Medium
S1 1.1769 - 20 January high - Medium
S2 1.1728 - 23 January low - Medium
EURUSD: fundamental overview

The euro climbed for a third straight day to near four-month highs as broad dollar weakness, driven by US fiscal concerns, shifting rate expectations, and policy uncertainty, continued to support EURUSD, which has now fully reversed its late-2025 slide. Better-than-expected German PMI data added a lift, though the recovery still looks shallow amid weak growth and falling employment, while cautious ECB messaging has tempered expectations for rapid rate cuts, helping the euro via rate differentials. Markets are also weighing geopolitical risks, EU-India trade progress, and a busy euro-area data week ahead, with German Ifo today and flash GDP, inflation, and labor figures on Friday set to shape near-term direction.

 
USDJPY: technical overview

There are signs of a meaningful top in place after the market put in a multi-year high in 2024. At this point, rallies should be well capped ahead of 160.00 in favor of a fresh down-leg back towards the 2024 low at 139.58. The recent break below 154.39 strengthens the outlook.

USDJPY Chart
R2 156.00 - Figure - Medium
R1 155.35 - 26 January high - Medium
S1 153.81 - 26 January/2026 low - Medium
S2 152.82 - 7 November low - Medium
USDJPY: fundamental overview

USDJPY slid about 1.1% to a 10-week low near 154 as the yen strengthened on a softer dollar and growing signs that Japan’s authorities are becoming less tolerant of currency-driven inflation. While the BOJ held rates at 0.75% in what markets see as a strategic pause, Governor Ueda explicitly tied yen weakness to inflation risks and signaled readiness to act if bond yields move abnormally. The move lower in USDJPY—reportedly accompanied by rate checks in Tokyo and New York—has revived intervention fears, with officials escalating warnings and analysts even flagging potential US-Japan coordination, reinforcing a perceived ceiling near the high-150s/160 and a more constructive bias for JPY on dips ahead of key Japan data this week.

 
AUDUSD: technical overview

There are signs of the potential formation of a longer-term base with the market trading down into a meaningful longer-term support zone. A monthly close back above 0.7000 will take the big picture pressure off the downside and strengthen case for a bottom. Setbacks should now be well supported ahead of 0.6300.

AUDUSD Chart
R2 0.7000 - Psychological - Strong
R1 0.6942 - 30 September/2025 high - Strong
S1 0.6834 - 23 January low - Medium
S2 0.6767 - 7 January high - Medium
AUDUSD: fundamental overview

The Australian dollar has climbed for six straight sessions, buoyed by a red-hot December jobs report that boosted expectations of a February RBA rate hike and positioned the AUD as a relative winner among G10 currencies. While some economists caution that underlying labor trends look softer than the headlines, markets increasingly view the RBA as one of the more hawkish developed central banks heading into 2026, especially versus a Fed expected to ease later this year. Attention now turns to Wednesday’s CPI, with strong unofficial inflation data raising the odds of a February hike toward certainty and potentially pushing AUDUSD above its October high. Although speculators remain net short, positions are being steadily covered, adding support to the currency ahead of a busy Australian data week.

 
Suggested reading

Google DeepMind chief warns AI investment looks ‘bubble-like’, R. Khalaf, Financial Times (January 24, 2026)

Gold, Fiat & Bitcoin: Which One Doesn’t Fit?, S. Sumner, The Pursuit of Happiness (January 22, 2026)


Any opinions, news, research, analyses, prices or other information ("information") contained on this Blog, constitutes marketing communication and it has not been prepared in accordance with legal requirements designed to promote the independence of investment research. Further, the information contained within this Blog does not contain (and should not be construed as containing) investment advice or an investment recommendation, or an offer of, or solicitation for, a transaction in any financial instrument. LMAX Group has not verified the accuracy or basis-in-fact of any claim or statement made by any third parties as comments for every Blog entry.

LMAX Group will not accept liability for any loss or damage, including without limitation to, any loss of profit, which may arise directly or indirectly from use of or reliance on such information. No representation or warranty is given as to the accuracy or completeness of the above information. While the produced information was obtained from sources deemed to be reliable, LMAX Group does not provide any guarantees about the reliability of such sources. Consequently any person acting on it does so entirely at his or her own risk. It is not a place to slander, use unacceptable language or to promote LMAX Group or any other FX and CFD provider and any such postings, excessive or unjust comments and attacks will not be allowed and will be removed from the site immediately.

Day Image
23rd January 2026 | view in browser
Central banks steady, risks simmer

Global macro is steady but cautious: the BOJ stayed on hold with a tightening bias as Japan inflation cooled, China signaled tolerance for slower growth alongside a firmer RMB, geopolitical and US policy headlines linger, and markets look to upcoming UK, European and US data for near-term direction while US equity futures edge higher.


Performance chart 30day v. USD (%)
Performance Chart
 
 
Technical & fundamental highlights
EURUSD: technical overview

The Euro outlook remains constructive with higher lows sought out on dips in favor of the next major upside extension targeting the 2021 high at 1.2350. Setbacks should be exceptionally well supported ahead of 1.1400.

EURUSD Chart
R2 1.1808 - 24 December high -Strong
R1 1.1769 - 20 Janaury high - Medium
S1 1.1632 - 20 January low - Medium
S2 1.1577 - 19 January /2026 low - Strong
EURUSD: fundamental overview

Euro price action has been dominated by political headlines, particularly around renewed US–Greenland tensions. Conflicting signals from Washington, NATO, Denmark, and Greenland itself suggest the issue could linger, risking fresh transatlantic friction that may revive de-dollarization flows and favor euro assets as an alternative safe haven. Separately, ECB officials said policy is “in a good place” but not on autopilot, with many favoring a prolonged hold on rates amid a fragile recovery, weak consumption, and limited domestic inflation pressure. While some policymakers see downside risks from factors like US tariffs, others warn that wage growth and sticky services inflation could still pose upside risks.

 
USDJPY: technical overview

There are signs of a meaningful top in place after the market put in a multi-year high in 2024. At this point, rallies should be well capped ahead of 160.00 ahead of a fresh down-leg back towards the 2024 low at 139.58. A break below 154.39 will strengthen the outlook.

USDJPY Chart
R2 160.00 - Psychological - Strong
R1 159.46 - 14 January /2026 high - Medium
S1 157.42 - 19 January low - Medium
S2 156.11 - 5 January/2026 low - Strong
USDJPY: fundamental overview

USD/JPY ticked up after the BOJ left rates unchanged at 0.75%, with markets focused less on the decision and more on Governor Ueda’s messaging around yen weakness, inflation risks, and the timing of the next move. With a snap election looming, Ueda is expected to avoid firm guidance, carefully balancing concerns that further yen depreciation could accelerate hikes against political sensitivities and bond-market stress. While growth forecasts may be revised higher and inflation data show headline pressures easing on subsidies, underlying inflation remains firm, keeping expectations intact for another BOJ rate increase around mid-year despite today’s steady stance.

 
AUDUSD: technical overview

There are signs of the potential formation of a longer-term base with the market trading down into a meaningful longer-term support zone. Only a monthly close below 0.5500 would give reason for rethink. A monthly close back above 0.7000 will take the big picture pressure off the downside and strengthen case for a bottom.

AUDUSD Chart
R2 0.6900 - Figure - Medium
R1 0.6853 - 23 January/2026 high - Medium
S1 0.6753 - 22 January low - Medium
S2 0.6660 - 31 December low - Strong
AUDUSD: fundamental overview

The Australian Dollar is tracking near a 15-month high around 0.6850, underpinned by a much stronger-than-expected December jobs report and improving January flash PMIs, both of which have lifted expectations for an RBA rate hike. Employment rose sharply, led by full-time jobs, while unemployment fell to 4.1%, reinforcing the view of genuine labor-market strength. As a result, markets have repriced February hike odds from roughly 25–30% to around 50–60%, with a move fully priced by May, though the RBA is still expected to remain broadly gradual. The next CPI print is now decisive: a firm outcome could turn a February hike into the base case and extend the AUD’s upside, while recent PMIs already point to a clear re-acceleration in domestic growth, led by services.

 
Suggested reading

This Indicator Just Flashed Most Bullish Signal Since ’00, M. Hulbert, Marketwatch (January 21, 2026)

The Real Secret To Warren Buffett’s Investing Success, L. Swedroe, Morningstar (January 22, 2026)


Any opinions, news, research, analyses, prices or other information ("information") contained on this Blog, constitutes marketing communication and it has not been prepared in accordance with legal requirements designed to promote the independence of investment research. Further, the information contained within this Blog does not contain (and should not be construed as containing) investment advice or an investment recommendation, or an offer of, or solicitation for, a transaction in any financial instrument. LMAX Group has not verified the accuracy or basis-in-fact of any claim or statement made by any third parties as comments for every Blog entry.

LMAX Group will not accept liability for any loss or damage, including without limitation to, any loss of profit, which may arise directly or indirectly from use of or reliance on such information. No representation or warranty is given as to the accuracy or completeness of the above information. While the produced information was obtained from sources deemed to be reliable, LMAX Group does not provide any guarantees about the reliability of such sources. Consequently any person acting on it does so entirely at his or her own risk. It is not a place to slander, use unacceptable language or to promote LMAX Group or any other FX and CFD provider and any such postings, excessive or unjust comments and attacks will not be allowed and will be removed from the site immediately.

Day Image
22nd January 2026 | view in browser
Commodity FX outperforms

Global markets head into the new day with commodity currencies in the lead, as the Aussie and kiwi outperform while the US dollar remains soft and struggles to extend its rebound from recent lows.


Performance chart 30day v. USD (%)
Performance Chart
 
 
Technical & fundamental highlights
EURUSD: technical overview

The Euro outlook remains constructive with higher lows sought out on dips in favor of the next major upside extension targeting the 2021 high at 1.2350. Setbacks should be exceptionally well supported ahead of 1.1400.

EURUSD Chart
R2 1.1808 - 24 December high -Strong
R1 1.1769 - 20 Janaury high - Medium
S1 1.1632 - 20 January low - Medium
S2 1.1577 - 19 January /2026 low - Strong
EURUSD: fundamental overview

The euro is holding much of this week’s rebound after bouncing off key technical support, as easing risk headlines helped stabilize the dollar without driving a fresh leg higher for EUR. Meanwhile, one major European bank research note warning of gradual European portfolio rebalancing away from US assets has sparked an unusually strong pushback from both a CEO and the US Treasury Secretary, underscoring how sensitive Washington is to the idea of “weaponizing” US assets given America’s large negative international investment position. Recent market moves — weaker US equities and dollar alongside rising long-dated Treasury yields — suggest investors are already demanding a higher premium for US political and fiscal risk, with the Greenland and tariff talks now the next potential flashpoint.

 
USDJPY: technical overview

There are signs of a meaningful top in place after the market put in a multi-year high in 2024. At this point, rallies should be well capped ahead of 160.00 ahead of a fresh down-leg back towards the 2024 low at 139.58. A break below 154.39 will strengthen the outlook.

USDJPY Chart
R2 160.00 - Psychological - Strong
R1 159.46 - 14 January /2026 high - Medium
S1 157.42 - 19 January low - Medium
S2 156.11 - 5 January/2026 low - Strong
USDJPY: fundamental overview

USDJPY has edged up, keeping the yen under pressure as fiscal worries persist and the BoJ begins its two-day meeting, where rates are expected to stay at 0.75% but with a more cautious tone on yen weakness and inflation risks. Markets see the January 23 decision and Governor Ueda’s press conference as a high-volatility event, with no hike likely keeping USDJPY elevated, though any hint of an easier path to future tightening could trigger a sharp yen rebound. Near term, rising JGB yields and political uncertainty are weighing on Japanese assets and the yen, but over time higher domestic yields and policy normalization should improve the yen’s fundamental appeal and support a stronger currency after the current stress phase fades.

 
AUDUSD: technical overview

There are signs of the potential formation of a longer-term base with the market trading down into a meaningful longer-term support zone. Only a monthly close below 0.5500 would give reason for rethink. A monthly close back above 0.7000 will take the big picture pressure off the downside and strengthen case for a bottom.

AUDUSD Chart
R2 0.6900 - Figure - Medium
R1 0.6811 - 22 January/2026 high - Medium
S1 0.6753 - 22 January low - Medium
S2 0.6660 - 31 December low - Strong
AUDUSD: fundamental overview

The Australian dollar led gains to fresh yearly highs after a strong December jobs report showed a 65,200 increase in employment and a drop in unemployment to a seven-month low of 4.1%. Markets have quickly shifted to a more hawkish RBA outlook, now pricing around a 60% chance of a February rate hike, with bank forecasts split and the meeting seen as genuinely “live.” Recent data point to resilient demand and still-sticky inflation, keeping tightening expectations elevated, while speculators remain net short AUD but have sharply reduced those positions since November.

 
Suggested reading

From Rock n’ Roll to Tech: Talent Flees Taxes, D. McCarthy, Chronicles Magazine (January 19, 2026)

17 Days In, 2026 Outlooks Already Discredited, J. Calhoun, Alhambra (January 20, 2026)


Any opinions, news, research, analyses, prices or other information ("information") contained on this Blog, constitutes marketing communication and it has not been prepared in accordance with legal requirements designed to promote the independence of investment research. Further, the information contained within this Blog does not contain (and should not be construed as containing) investment advice or an investment recommendation, or an offer of, or solicitation for, a transaction in any financial instrument. LMAX Group has not verified the accuracy or basis-in-fact of any claim or statement made by any third parties as comments for every Blog entry.

LMAX Group will not accept liability for any loss or damage, including without limitation to, any loss of profit, which may arise directly or indirectly from use of or reliance on such information. No representation or warranty is given as to the accuracy or completeness of the above information. While the produced information was obtained from sources deemed to be reliable, LMAX Group does not provide any guarantees about the reliability of such sources. Consequently any person acting on it does so entirely at his or her own risk. It is not a place to slander, use unacceptable language or to promote LMAX Group or any other FX and CFD provider and any such postings, excessive or unjust comments and attacks will not be allowed and will be removed from the site immediately.

Day Image
21st January 2026 | view in browser
Bonds, borders and central banks

Global markets open the day on edge as Japan’s bond turmoil, rising US–Europe trade tensions and looming tariff risks, and a renewed inflation focus in the UK collide with heavy global bond supply, fragile growth expectations, and increasingly divergent central bank paths across the US, Europe, and Asia.


Performance chart 30day v. USD (%)
Performance Chart
 
 
Technical & fundamental highlights
EURUSD: technical overview

The Euro outlook remains constructive with higher lows sought out on dips in favor of the next major upside extension targeting the 2021 high at 1.2350. Setbacks should be exceptionally well supported ahead of 1.1400.

EURUSD Chart
R2 1.1808 - 24 December high -Strong
R1 1.1769 - 20 Janaury high - Medium
S1 1.1632 - 20 January low - Medium
S2 1.1577 - 19 January /2026 low - Strong
EURUSD: fundamental overview

The euro eased after the prior session’s rally, but remains supported by a sharp jump in Germany’s ZEW expectations index to its highest level since mid-2021, reflecting optimism around large fiscal programs and the view that 2026 could mark a turning point for Europe’s economy. ECB officials signaled rates are likely to stay on hold with a mild easing bias, helping limit EUR downside, while Trump’s tariff threats and clashes with Europe have unsettled markets and raised longer-term risks for the dollar, highlighted by a Danish pension fund’s decision to exit its US Treasury holdings over policy concerns.

 
USDJPY: technical overview

There are signs of a meaningful top in place after the market put in a multi-year high in 2024. At this point, rallies should be well capped ahead of 160.00 ahead of a fresh down-leg back towards the 2024 low at 139.58. A break below 154.39 will strengthen the outlook.

USDJPY Chart
R2 160.00 - Psychological - Strong
R1 159.46 - 14 January /2026 high - Medium
S1 157.42 - 19 January low - Medium
S2 156.11 - 5 January/2026 low - Strong
USDJPY: fundamental overview

The yen is holding relatively steady despite a difficult domestic backdrop marked by fiscal worries and election uncertainty. While weak fundamentals and politics continue to weigh on the currency, sharply rising JGB yields, growing expectations for BOJ rate hikes and the risk of FX intervention near 160 are making further dollar gains increasingly asymmetric over the next couple of weeks. Markets expect the BOJ to hold rates at its 23 January meeting, but with officials paying closer attention to yen weakness and inflation, any move through 160 could prompt either a policy shift or direct intervention, keeping volatility high.

 
AUDUSD: technical overview

There are signs of the potential formation of a longer-term base with the market trading down into a meaningful longer-term support zone. Only a monthly close below 0.5500 would give reason for rethink. A monthly close back above 0.7000 will take the big picture pressure off the downside and strengthen case for a bottom.

AUDUSD Chart
R2 0.6800 - Figure - Medium
R1 0.6767 - 7 January/2026 high - Medium
S1 0.6660 - 31 December low - Medium
S2 0.6592 - 18 December low - Strong
AUDUSD: fundamental overview

The Aussie dollar dipped slightly after retesting recent highs, as markets look ahead to Thursday’s labor data and a genuinely “live” February RBA meeting. Investors are pricing the most aggressive tightening path in G10 for 2026, contrasting with expected Fed cuts and underpinning AUD support, while domestic data point to resilient demand and still-elevated inflation. Bank forecasts are split on a February hike, and positioning shows specs remain net short but have covered sharply since November, suggesting consolidation ahead as traders wait for fresh catalysts.

 
Suggested reading

It’s About Avoiding Big, Irreversible Mistakes, C. Reilly, RiskHedge (January 19, 2026)

Cheap S&P 500 Stocks That Can Cushion a Correction, M. Hulbert, Marketwatch (January 17, 2026)


Any opinions, news, research, analyses, prices or other information ("information") contained on this Blog, constitutes marketing communication and it has not been prepared in accordance with legal requirements designed to promote the independence of investment research. Further, the information contained within this Blog does not contain (and should not be construed as containing) investment advice or an investment recommendation, or an offer of, or solicitation for, a transaction in any financial instrument. LMAX Group has not verified the accuracy or basis-in-fact of any claim or statement made by any third parties as comments for every Blog entry.

LMAX Group will not accept liability for any loss or damage, including without limitation to, any loss of profit, which may arise directly or indirectly from use of or reliance on such information. No representation or warranty is given as to the accuracy or completeness of the above information. While the produced information was obtained from sources deemed to be reliable, LMAX Group does not provide any guarantees about the reliability of such sources. Consequently any person acting on it does so entirely at his or her own risk. It is not a place to slander, use unacceptable language or to promote LMAX Group or any other FX and CFD provider and any such postings, excessive or unjust comments and attacks will not be allowed and will be removed from the site immediately.

Day Image
20th January 2026 | view in browser
Tariffs, turmoil and treasuries

Rising global yields, political risk, and escalating trade frictions are creating a fragile macro backdrop for investors heading into the new day.


Performance chart 30day v. USD (%)
Performance Chart
 
 
Technical & fundamental highlights
EURUSD: technical overview

The Euro outlook remains constructive with higher lows sought out on dips in favor of the next major upside extension targeting the 2021 high at 1.2350. Setbacks should be exceptionally well supported ahead of 1.1400.

EURUSD Chart
R2 1.1808 - 24 December high -Strong
R1 1.1699 - 12 Janaury high - Medium
S1 1.1577 - 19 January /2026 low - Medium
S2 1.1530 - 7 November low - Medium
EURUSD: fundamental overview

The euro edged up as a softer dollar followed President Trump’s threat of tariffs linked to the Greenland dispute, reviving political risk just as European assets had been attracting fresh inflows. European leaders condemned the move, the EU froze approval of a July trade deal, and lawmakers are weighing retaliatory tools, warning of a serious rupture in transatlantic ties. While markets see uncertainty over whether the tariffs will be implemented, analysts note even a 10% levy could shave about 0.1%–0.2% off euro-area GDP, with Germany most exposed, and keep attention on Europe’s political response and today’s ZEW sentiment data.

 
USDJPY: technical overview

There are signs of a meaningful top in place after the market put in a multi-year high in 2024. At this point, rallies should be well capped ahead of 160.00 ahead of a fresh down-leg back towards the 2024 low at 139.58. A break below 154.39 will strengthen the outlook.

USDJPY Chart
R2 160.00 - Psychological - Strong
R1 159.46 - 14 January /2026 high - Medium
S1 157.42 - 19 January low - Medium
S2 156.11 - 5 January/2026 low - Strong
USDJPY: fundamental overview

The yen has edged slightly stronger but remains under pressure, with USDJPY still holding near multi-month highs as rising long-term JGB yields, fiscal easing concerns under PM Takaichi, and the Feb. 8 snap election keep investors cautious. Markets are positioning for a continued “sell-yen” macro mix of looser fiscal policy offsetting any BOJ tightening, though heavy speculative shorts leave the currency vulnerable to sharp squeezes on any BOJ hawkish surprise, intervention risk, or global risk-off move.

 
AUDUSD: technical overview

There are signs of the potential formation of a longer-term base with the market trading down into a meaningful longer-term support zone. Only a monthly close below 0.5500 would give reason for rethink. A monthly close back above 0.7000 will take the big picture pressure off the downside and strengthen case for a bottom.

AUDUSD Chart
R2 0.6800 - Figure - Medium
R1 0.6767 - 7 January/2026 high - Medium
S1 0.6660 - 31 December low - Medium
S2 0.6592 - 18 December low - Strong
AUDUSD: fundamental overview

AUD has regained momentum and is one of the best-performing G10 currencies versus the dollar. Strong December inflation data points to sticky Q4 CPI, keeping the RBA firmly in “hold or hike” mode, with markets pricing around 40bp of tightening this year — the most hawkish path in G10. With inflation likely to stay above target well into 2026 and some major banks forecasting a hike as early as February, Australia stands out as a rare tightening outlier, reinforcing the bullish AUD narrative even as speculative shorts are gradually being unwound.

 
Suggested reading

How State Capital Is Reshaping Supply Chains, W. Marshall, CFA Institute (January 12, 2026)

2026 Outlook: Smothering Heights, M. Cembalest, J.P. Morgan (January 1, 2026)


Any opinions, news, research, analyses, prices or other information ("information") contained on this Blog, constitutes marketing communication and it has not been prepared in accordance with legal requirements designed to promote the independence of investment research. Further, the information contained within this Blog does not contain (and should not be construed as containing) investment advice or an investment recommendation, or an offer of, or solicitation for, a transaction in any financial instrument. LMAX Group has not verified the accuracy or basis-in-fact of any claim or statement made by any third parties as comments for every Blog entry.

LMAX Group will not accept liability for any loss or damage, including without limitation to, any loss of profit, which may arise directly or indirectly from use of or reliance on such information. No representation or warranty is given as to the accuracy or completeness of the above information. While the produced information was obtained from sources deemed to be reliable, LMAX Group does not provide any guarantees about the reliability of such sources. Consequently any person acting on it does so entirely at his or her own risk. It is not a place to slander, use unacceptable language or to promote LMAX Group or any other FX and CFD provider and any such postings, excessive or unjust comments and attacks will not be allowed and will be removed from the site immediately.