


 | ||
| 15th August 2025 | view in browser | ||
| PPI shock boosts US Dollar | ||
| The U.S. dollar gained strength on Thursday following a surprisingly high July Producer Price Index, which rose 0.9% month-over-month, far exceeding the expected 0.2%. | ||
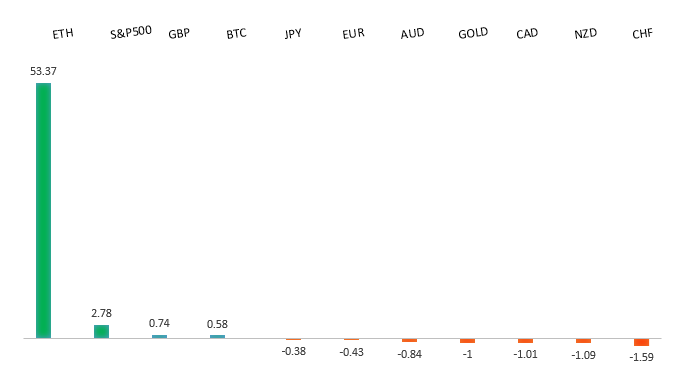
| Performance chart 30day v. USD (%) | ||
 | ||
| Technical & fundamental highlights | ||
| EURUSD: technical overview | ||
| The Euro has broken out from a multi-month consolidation off a critical longer-term low. This latest push through the 2023 high (1.1276) lends further support to the case for a meaningful bottom, setting the stage for a bullish structural shift and the next major upside extension targeting the 2021 high at 1.2350. Setbacks should be exceptionally well supported ahead of 1.1000. | ||
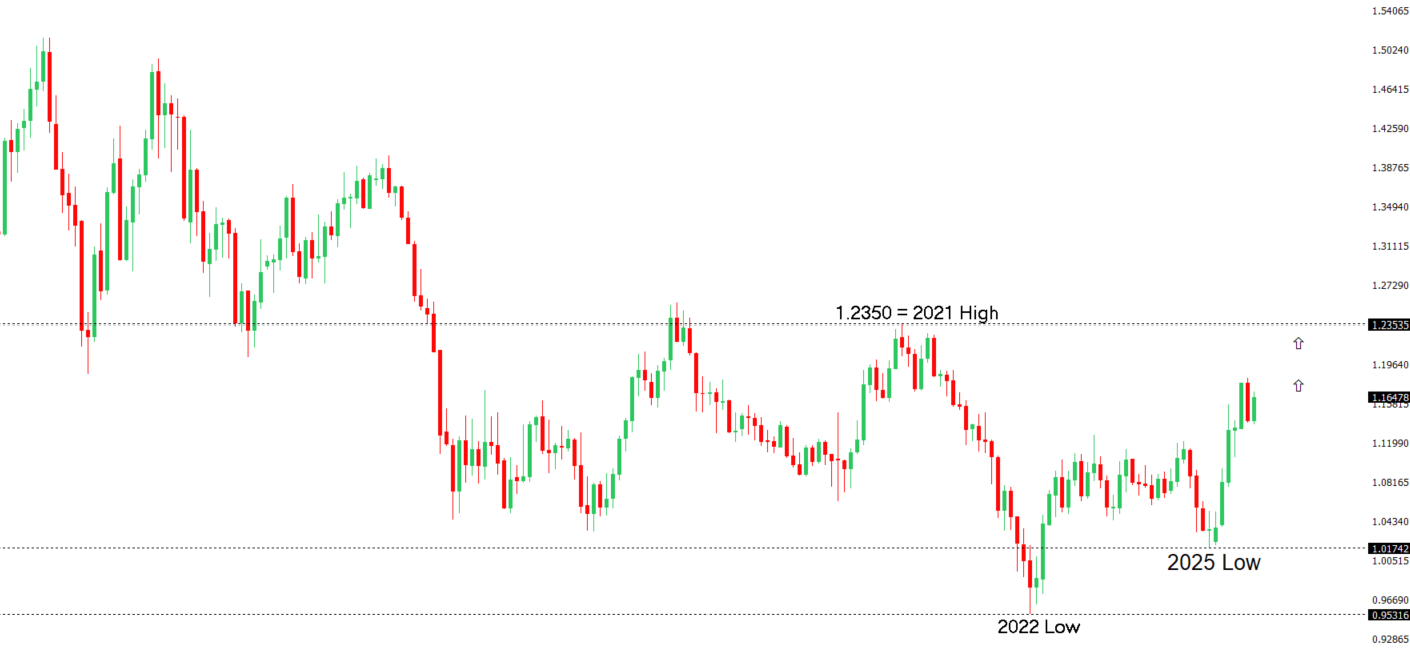 | ||
| R2 1.1789 - 24 July high - Medium R1 1.1731 - 13 August high - Medium S1 1.1528 - 5 August low - Medium S2 1.1392 - 1 August low - Strong | ||
| EURUSD: fundamental overview | ||
| The euro’s strength against the dollar has eased slightly after US PPI data raised doubts about aggressive Federal Reserve rate cuts, though markets still expect at least three Fed cuts by Q1 2026. The ECB is likely to hold rates steady in September, with some anticipating a future hike as Germany’s fiscal stimulus grows, supporting a bullish euro outlook due to diverging Fed and ECB policies. Hedge funds are increasing euro exposure via short-term call options, while two major US banks predict euro gains to $1.20-$1.22 by mid-2026, citing US stagflation risks and growth moderation. Eurozone data showed weaker-than-expected industrial production, and markets are monitoring the Trump-Putin summit for potential impacts on Russian oil sanctions, which could influence volatility. | ||
| USDJPY: technical overview | ||
| There are signs of a meaningful top in place after the market put in a multi-year high in 2024. At this point, the door is now open for a deeper setback below the 2024 low at 139.58, exposing a retest of the 2023 low. Rallies should be well capped below 152.00. | ||
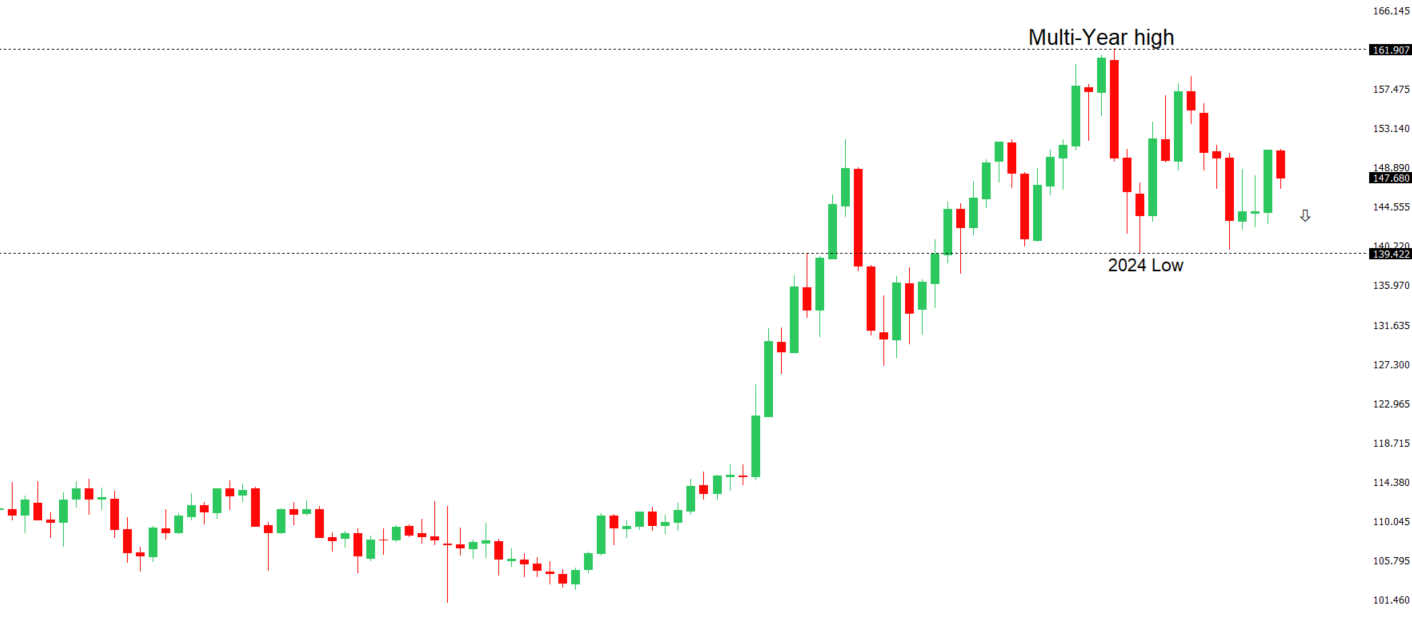 | ||
| R2 150.92 - 1 August high - Strong R1 148.52 - 12 August high - Medium S1 146.21 - 14 August low - Medium S2 145.85 - 24 July low - Strong | ||
| USDJPY: fundamental overview | ||
| U.S. Treasury Secretary Bessent, in a Bloomberg interview, urged Japan to control inflation and hinted at tighter monetary policy to avoid disruptive global yield spikes and market volatility, possibly signaling a U.S. preference for a weaker dollar. Japan’s Q2 2025 GDP grew at a stronger-than-expected 1% annualized rate, driven by robust business investment (1.3%) and modest private consumption growth (0.2%), avoiding a recession. Despite U.S. tariffs impacting trade, domestic demand bolstered Japan’s economy, offering political relief to Prime Minister Ishiba’s government amid calls for his resignation after a recent electoral loss. | ||
| AUDUSD: technical overview | ||
| There are signs of the potential formation of a longer-term base with the market trading down into a meaningful longer-term support zone. Only a monthly close below 0.5500 would give reason for rethink. A monthly close back above 0.7000 will take the big picture pressure off the downside and strengthen case for a bottom. | ||
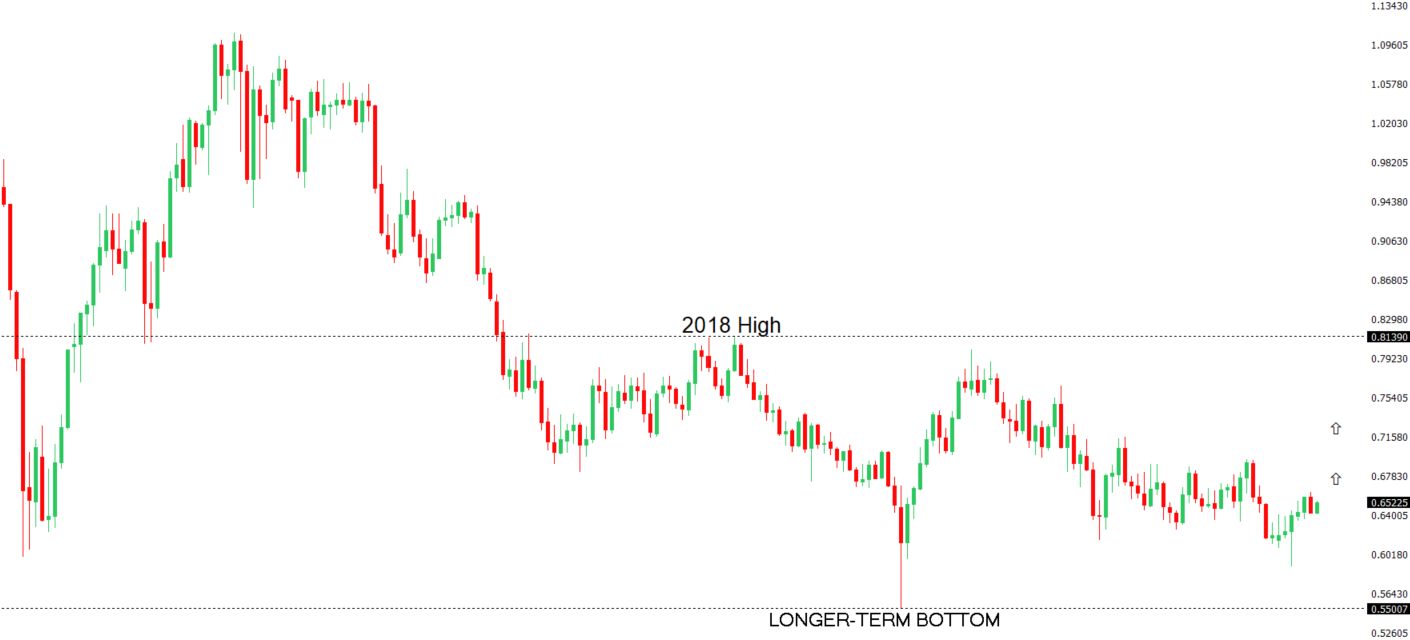 | ||
| R2 0.6600 - Figure - Medium R1 0.6569 - 14 August high - Medium S1 0.6419 - 1 August low - Medium S1 0.6373 - 23 June low - Strong | ||
| AUDUSD: fundamental overview | ||
| Australia’s labor market remains robust, with employment rising by 24,500 in July and the unemployment rate dropping to 4.2%, surpassing the Reserve Bank of Australia’s expectations. A significant shift from part-time to full-time jobs, with 60,500 new full-time positions, signals stronger job security and consumer spending potential, supporting economic growth. Despite stable wage growth at 3.4%, the RBA is cautious, with no immediate rate cuts planned, while China’s contracting bank lending may boost the Australian dollar through anticipated stimulus measures. | ||
| Suggested reading | ||
| Do Consumers Really Benefit From Cheap Imports, M. Pettis, FT Alphaville (August 13, 2025) Tariffs Don’t Fuel Scorching Inflation, Fisher Investments (August 12, 2025) | ||