


 | ||
| 6th October 2026 | view in browser | ||
| Record stocks, restless bonds | ||
| Markets head into Tuesday with technology-led equity strength competing against rising bond yields, while the dollar remains supported and persistent Middle East energy disruptions and European fiscal concerns keep inflation and geopolitical risks in focus. | ||
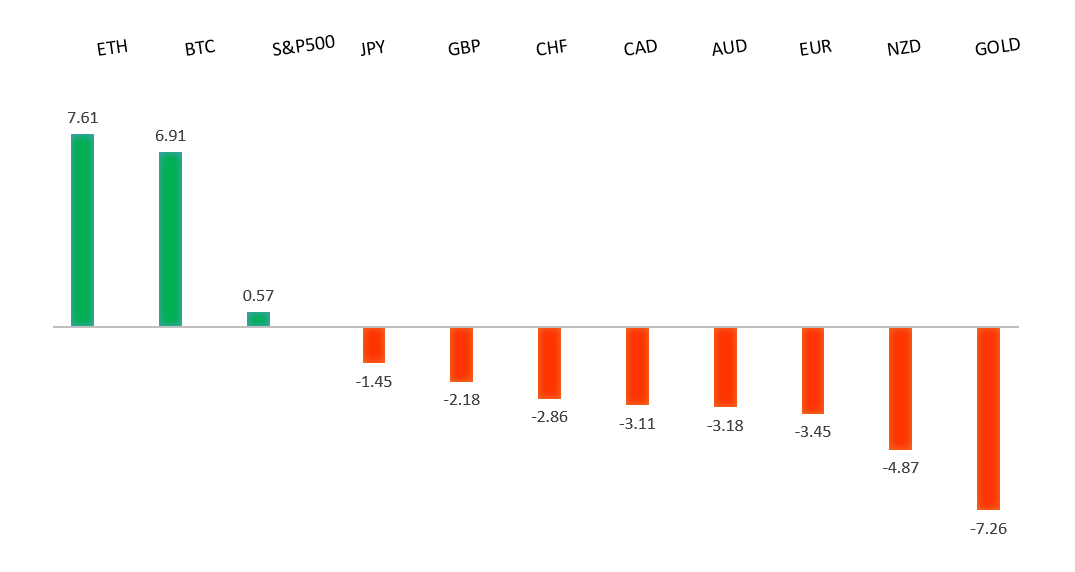
| Performance chart 30day v. USD (%) | ||
 | ||
| Technical & fundamental highlights | ||
| EURUSD: technical overview | ||
| The Euro continues to show signs of wanting to carve out a major bottom after trading down to a 20-year low in 2022. Setbacks should be exceptionally well supported above 1.1200 on a weekly close basis ahead of the next major upside extension back above 1.2000. | ||
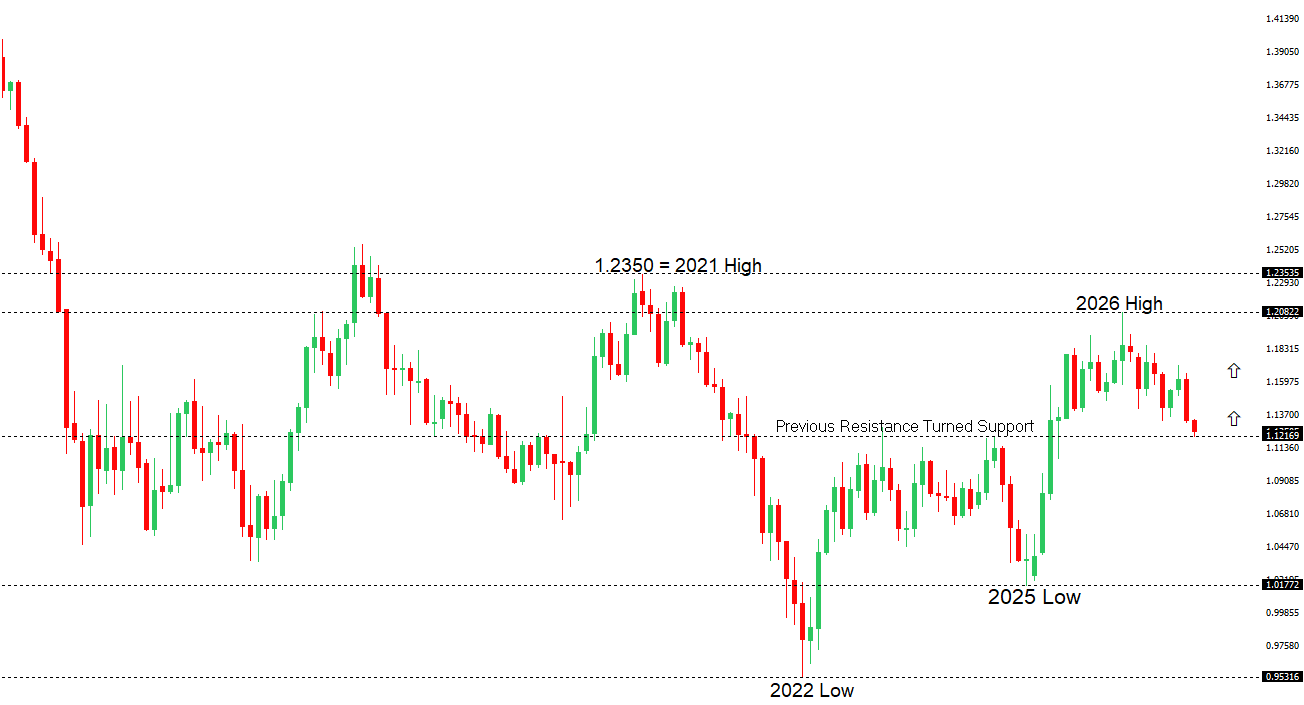 | ||
| R2 1.1337 - 1 October high - Medium R1 1.1286 - 2 October high - Medium S1 1.1161 - 4 Octoberber/2026 low - Strong S2 1.1100 - Figure - Strong | ||
| EURUSD: fundamental overview | ||
| The euro remains under pressure as concerns over France’s budget deficit, rising borrowing costs and ability to deliver fiscal savings undermine confidence, with political uncertainty in Spain adding to the cautious mood. Uncertainty over potential ECB intervention is also weighing, as its bond-market backstop is conditional on fiscal and economic policies. Higher long-term yields are tightening financial conditions and could constrain further ECB rate increases, although Nagel’s warnings about upside inflation risks offer some support. Meanwhile, weaker US jobs data have reduced expectations for an October Fed hike, providing a partial counterweight to Europe’s fiscal concerns and tempering support for the dollar. | ||
| GBPUSD: technical overview | ||
| The Pound remains exceptionally well supported on dips into the 1.3000 area, with the price largely consolidating above the psychological barrier and previous resistance turned support in the form of the 2023 high. Look for the market to continue be well supported on dips ahead of the next major upside extension through the yearly high at 1.3870 and towards a retest of the 2018 high at 1.4377 further up. Only a monthly close below 1.3000 negates. | ||
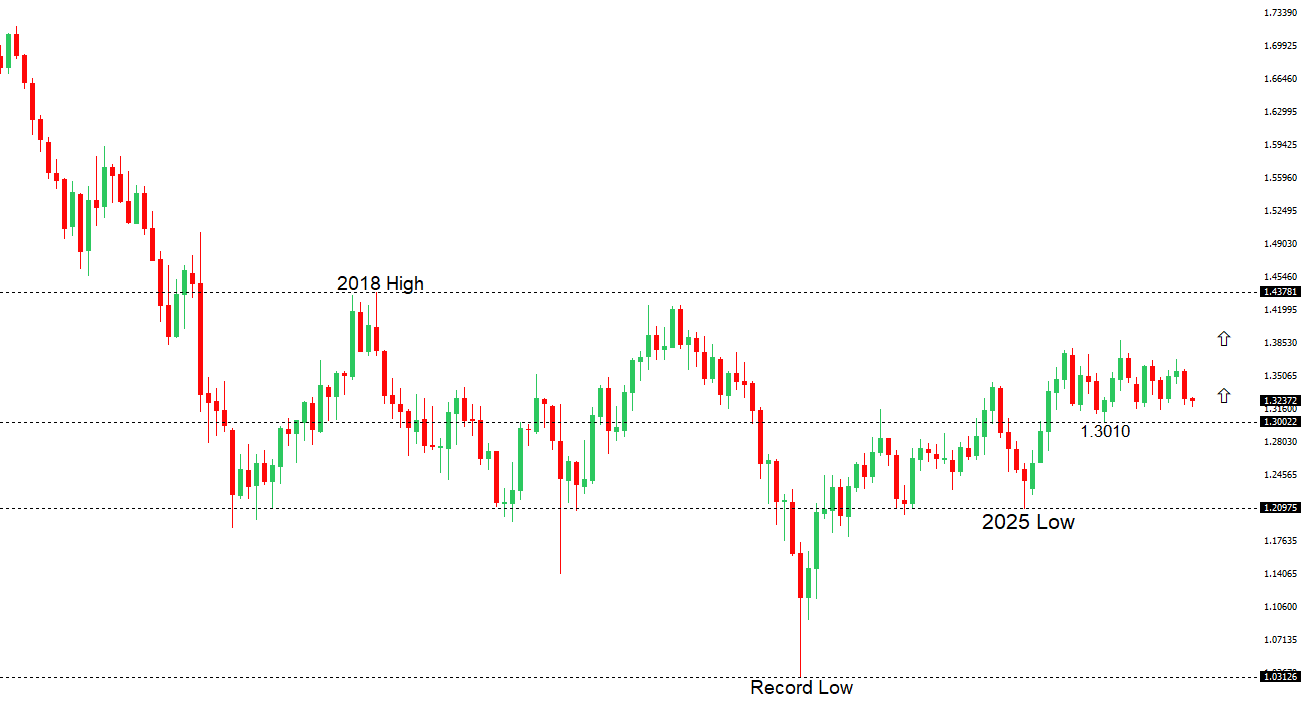 | ||
| R2 1.3407 - 17 September high - Medium R1 1.3312 - 30 September high - Medium S1 1.3181 - 1 October low - Medium S2 1.3140 - 24 June/2026 low - Strong | ||
| GBPUSD: fundamental overview | ||
| The pound remains caught between support from expectations for tighter Bank of England policy and pressure from a broadly firm US dollar. Sticky inflation, fueled by elevated energy prices, and recent comments from BoE officials have reinforced rate hike expectations, while France’s fiscal troubles have helped sterling outperform the euro. Against the dollar, however, geopolitical uncertainty and elevated US Treasury yields continue to cap gains. Softer US employment data have reduced expectations for an October Fed hike, but persistent inflation concerns are keeping further tightening in play. Attention now turns to Wednesday’s FOMC minutes and central bank commentary for clearer guidance on the relative policy outlook. | ||
| USDJPY: technical overview | ||
| The recent breakdown below 155.00 suggests the market could be on the verge of a bigger structural shift, with the possibility for an end to a longer-term uptrend and the start to a period of persistent weakness. Critical support now comes in the form of the 2026 low from January at 151.97, with a drop below to strengthen the bearish outlook and open the door for a major downside extension targeting the 2024 low at 139.58. The market would need to get back above 160.00 to take the immediate pressure off the downside. | ||
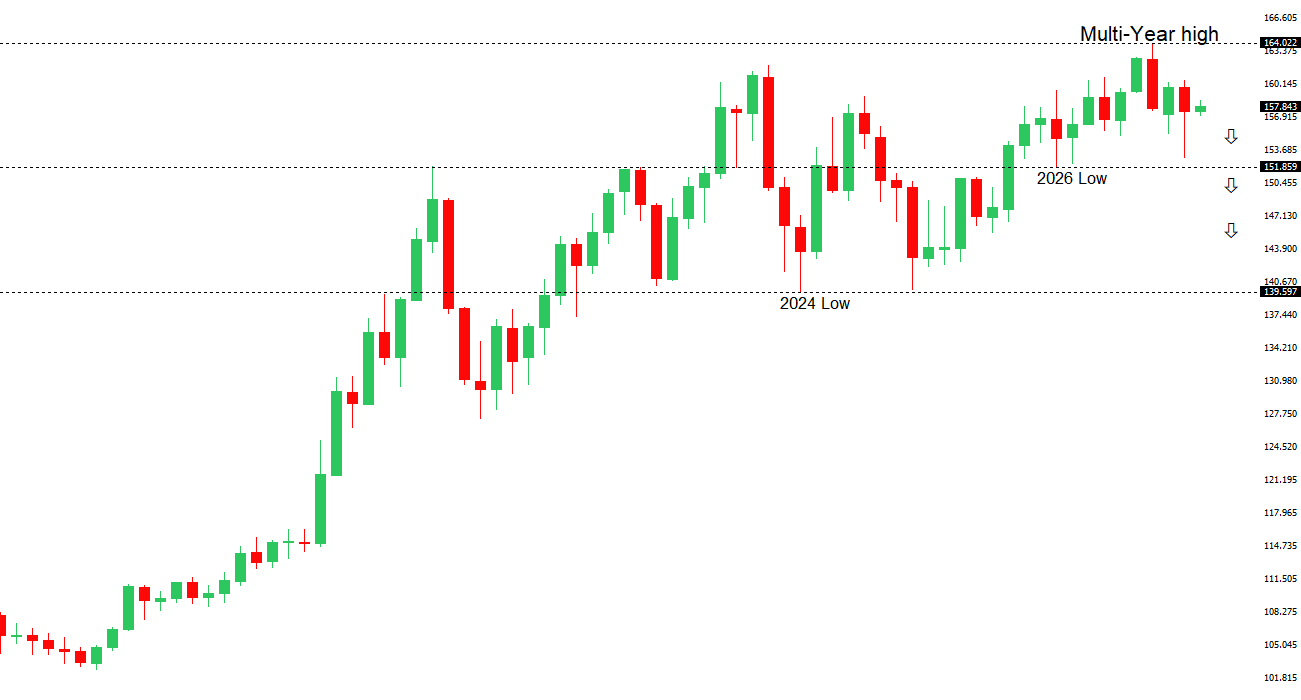 | ||
| R2 159.04 - 24 September high - Strong R1 158.46 - 1 October high - Medium S1 156.37 - 30 September low - Medium S2 155.33 - 17 September low - Medium | ||
| USDJPY: fundamental overview | ||
| The yen is drawing support from expectations of further Bank of Japan tightening, with reports suggesting policymakers could acknowledge this month that underlying inflation has broadly reached the 2% target. That would strengthen the case for a December rate increase, although officials appear inclined to assess the impact of September’s hike before moving again. However, renewed dollar strength continues to constrain the yen: softer US employment data have reduced expectations for an October Fed hike, but persistent inflation pressures are keeping further US tightening in play. The balance remains between Japan’s gradual policy normalization and a US rate outlook that continues to support the dollar. | ||
| AUDUSD: technical overview | ||
| There are signs of the formation of a longer-term base with the market recovering out from a meaningful longer-term support zone. The latest monthly close back above 0.7000 takes the big picture pressure off the downside and strengthens the case for a bottom, with the focus now on a push towards 0.8000. Setbacks should now be well supported ahead of 0.6700. | ||
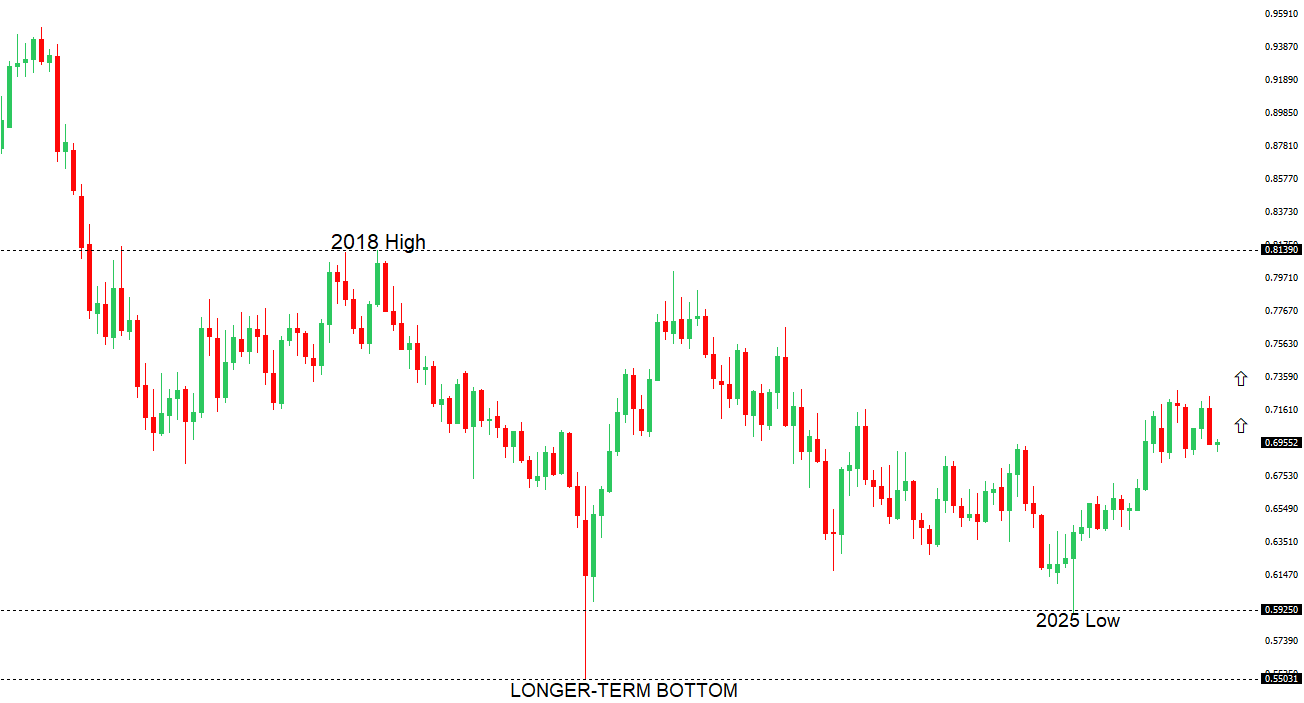 | ||
| R2 0.7142 - 15 September high - Strong R1 0.6995 - 30 September high - Medium S1 0.6904 - 1 October low - Medium S2 0.6865 - 30 June low - Strong | ||
| AUDUSD: fundamental overview | ||
| The Australian dollar is holding steady as easing global inflation concerns offset weaker domestic confidence. Consumer sentiment fell 4.7% in October, its second consecutive monthly decline, highlighting pressure on households from higher fuel costs and interest rates. While the RBA’s recent tightening offers yield support for the currency, it also raises concerns about consumer spending and growth. Westpac IQ Meanwhile, falling oil prices following the announced G7 emergency reserve release have eased fears of further inflation pressure and tighter US monetary policy, helping support the risk-sensitive Aussie. However, renewed Houthi attacks on Saudi targets threaten that relief, leaving the currency vulnerable to another rise in energy prices and stronger safe-haven demand for the US dollar. | ||
| Suggested reading | ||
| Ken Griffin’s Carnegie Mellon Bet Could Pay Off Big, J. Sailer, City Journal (October 2, 2026) The Fed’s Rate Hike Was a Bad Call, Not Bad Faith, R. Roberts, RCM (October 5, 2026) | ||