


Next 24 hours: What's moving and shaking the US Dollar?
Today’s report: A Goldilocks state of affairs
It’s all goldilocks for financial markets right now. US economic data has been impressive overall pointing to rebound, the coronavirus recovery outlook is looking up, and the US government is still prepared to pump more stimulus into the system on top of all of the positive developments.
Wake-up call
- US spending
- virus management
- stimulus efforts
- SNB policy
- RBA holds
- consumer confidence
- Trans-Tasman bubble
- Stocks vulnerable
- Dealers report
- Bigger money
- risk appetite
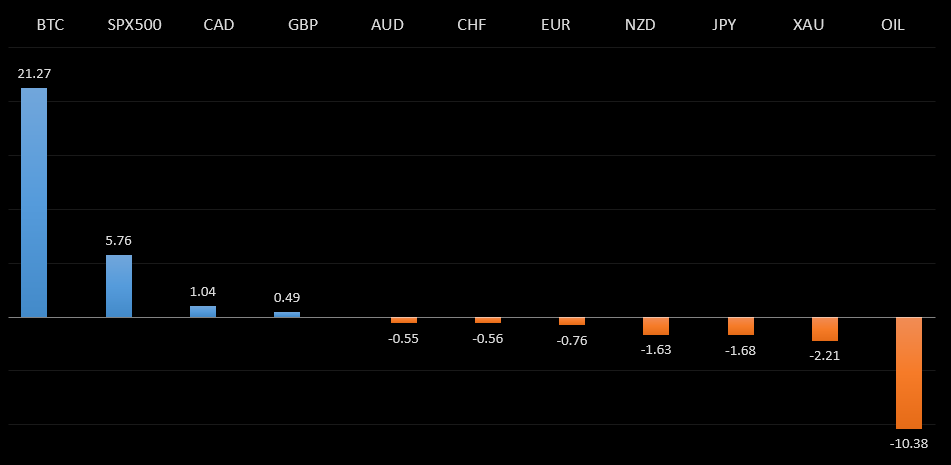
Peformance chart: 30 Day Performance vs. US dollar (%)
Suggested reading
- Nirvana for Stocks Rests on Faith in Fed Doves, J. Authers, Bloomberg (April 6, 2021)
- How China Uses Trade as a Weapon, J. Kynge, Financial Times (March 31, 2021)
Chart talk: Technical & fundamental highlights
Choose pair:
EURUSD – technical overview
The market is in the process of correcting following an impressive run to its highest levels since April 2018. There is room for additional downside over the coming sessions, though ultimately, the overall structure remains constructive and the market will be looking for that next higher low ahead of a bullish continuation. Only a break back below 1.1500 would negate the outlook.EURUSD – fundamental overview
The Euro gets back to fuller trade on Tuesday. We've seen a bit of a recovery as the theme of US fiscal spending has more of an impact than rising US yields. Key standouts on Tuesday’s calendar include Eurozone unemployment, US JOLTs job openings and US consumer inflation expectations.EURUSD - Technical charts in detail
GBPUSD – technical overview
Technical studies are in the process of unwinding from stretched levels after the push to fresh multi-month highs. This leaves room for additional setbacks over the coming sessions, before the market considers a meaningful bullish continuation towards a retest of the 2018 high. But look for setbacks to now be very well supported into the 1.3500 area.GBPUSD – fundamental overview
The Pound continues to benefit from UK management of the virus and vaccine rollout. Meanwhile, we've also seen demand on the back of the broad based US Dollar selling from US fiscal spending. Key standouts on Tuesday’s calendar include US JOLTs job openings and US consumer inflation expectations.USDJPY – technical overview
The rally over the past several weeks is less bullish in the context of the longer-term chart, which shows the market very much confined to tighter consolidation. Overall, the market is still tracking below the top of the monthly Ichimoku cloud, with risk for the run to stall out in favour of a bearish reversal below 113.00. It would take a clear break back above 113.00 to negate the outlook.USDJPY – fundamental overview
The Yen has weakened of late on the record run in US stocks, but it's been hard for an already very weak Yen to ignore the impact of massive US fiscal stimulus efforts resulting in broad based US Dollar selling. Key standouts on Tuesday’s calendar include US JOLTs job openings and US consumer inflation expectations.EURCHF – technical overview
Lots of sideways price action here, with no clear directional insight. For the most part, price action has been confined between 1.0600 and 1.1200, and it will take a weekly close above or below for an indication of the next big move.EURCHF – fundamental overview
The SNB remains uncomfortable with Franc appreciation and continues to remind the market it will need to be careful about any attempts at trying to force an appreciation in the currency. But the SNB will also need to be careful right now, as its strategy to weaken the Franc is facing headwinds from a less certain global outlook. Any signs of renewed risk liquidation will likely invite a very large wave of demand for the Franc that will put the SNB in the more challenging position of needing to back up its talk with action, that ultimately, may not prove to be as effective as it once was, given where we're at in the monetary policy cycle.AUDUSD – technical overview
Technical studies have turned up in recent months, after the market traded down to its lowest levels since 2003 in 2020. There is evidence of a longer-term bottom following the latest push back through 0.7000, though at this stage, there is risk for a deeper pullback to allow for shorter term studies to unwind. Setbacks should now be well supported ahead of 0.7400.AUDUSD – fundamental overview
The RBA left policy on hold as widely expected and offered no new insights into policy guidance going forward. The central bank reiterated that it doesn't anticipate a rate hike until 2024 and is prepared to undertake further bond purchases if needed. Key standouts on Tuesday’s calendar include US JOLTs job openings and US consumer inflation expectations.USDCAD – technical overview
Has been in major decline since topping out in 2021 above 1.4600. At this stage, with the decline now well extended, the market is likely to find solid support into the 1.2300-1.2500 area ahead of a resumption of gains. Ultimately, only a weekly close below 1.2400 would suggest otherwise. Back above 1.2743 will strengthen the outlook.USDCAD – fundamental overview
The Canadian Dollar got a boost on Monday from the Canada consumer confidence read which hit a record high for the third consecutive week. Meanwhile, Canada home prices continue to run higher. Of course, we've also seen broad based US Dollar selling on massive US fiscal stimulus efforts. Key standouts on Tuesday’s calendar include US JOLTs job openings and US consumer inflation expectations.NZDUSD – technical overview
Finally signs of topping out after a nice multi-month rally. Look for a weekly close below 0.7000 to strengthen the bearish outlook and expose deeper setbacks towards the 0.6500 area. Back above 0.7300 would be required to take the immediate pressure off the downside.NZDUSD – fundamental overview
The New Zealand Dollar has played a game of follow the leader as it watched Aussie react to the latest RBA decision. New Zealand has agreed to open a quarantine-free Trans-Tasman travel bubble with Australia starting April 19. Key standouts on Tuesday’s calendar include the GDT auction, US JOLTs job openings and US consumer inflation expectations.US SPX 500 – technical overview
Longer-term technical studies are looking quite exhausted and the market is showing signs of wanting to roll over after racing to another record high. Look for rallies to be well capped ahead of 4100, with a break back below 3700 to strengthen the outlook.US SPX 500 – fundamental overview
We're trading just off fresh record highs, and yet, with so little room for additional central bank accommodation, given an already depressed interest rate environment, the prospect for sustainable runs to the topside on easy money policy incentives and government stimulus, should no longer be as enticing to investors. Meanwhile, ongoing worry associated with coronavirus fallout should weigh more heavily on investor sentiment in 2021.GOLD (SPOT) – technical overview
The 2019 breakout above the 2016 high at 1375 was a significant development, opening the door for fresh record highs and an acceleration beyond the next major psychological barrier at 2000. Setbacks should now be well supported above 1600. Longer-term technical studies are however in the process of unwinding, with the market in search of a higher low ahead of a bullish continuation.GOLD (SPOT) – fundamental overview
The yellow metal continues to be well supported on dips with solid demand from medium and longer-term accounts. These players are more concerned about exhausted monetary policy, extended global equities, and coronavirus fallout. All of this should keep the commodity well supported, with many market participants also fleeing to the hard asset as the grand dichotomy of record high equities and record low yields comes to an unnerving climax.BTCUSD – technical overview
Monthly technical readings are still tracking in severe overbought territory heading into Q2 2021. Risk for any meaningful bullish continuation beyond the recent record high just over $60,000 should be limited over the coming days and weeks, with the higher probability leaning towards more correction and consolidation. There is now room for the correction to extend back down into the $40,000 area, where a higher low would ideally be sought out for a resumption of the bigger picture uptrend.BTCUSD – fundamental overview
Heading into 2021, there was a great anticipation for institutional adoption. And as we saw follow through on this anticipation, the bitcoin price tripled in value, exploding to a record high beyond $60,000. But with much of that now priced into the market, and with short-term bitcoin fundamentals still correlating with global risk sentiment, there does appear to be room for somewhat of an adjustment lower in the price before we see that next wave of renewed demand. We also believe bitcoin's emergence into the mainstream will invite more challenge and scrutiny from central banks and governments, which could translate to a bumpy ride in Q2 2021 before the asset once again finds its legs on the compelling longer-term value proposition.BTCUSD - Technical charts in detail
ETHUSD – technical overview
Despite the latest run to a fresh record high through $2,000, the market is looking quite extended following a massive run higher in 2021. At this stage, additional upside should be limited to allow for extended studies to unwind, before the market considers a meaningful bullish continuation. Look for setbacks to be well supported ahead of $1,500.ETHUSD – fundamental overview
Ether is in the process of an overdue price correction and consolidation after an explosive start to 2021 that resulted in fresh record highs beyond $2,000. There were already signs of overvaluation in the defi space and this in conjunction with a deterioration in global risk sentiment have been behind a lot of this downside pressure. Still, we believe there will be plenty of demand for ether down into the $1,000 area.