


Special report: ECB policy decision preview
Today’s report: Proceed with caution
We suspect volatility will be picking up today, in light of all the event risk on the economic calendar. Key standouts come in the form of the ECB policy decision, US initial jobless claims and US inflation data.
Wake-up call
- German trade
- trade tariffs
- PM Suga
- RBA taper
- Futures price
- Kiwi hit
- Stocks vulnerable
- Dealers report
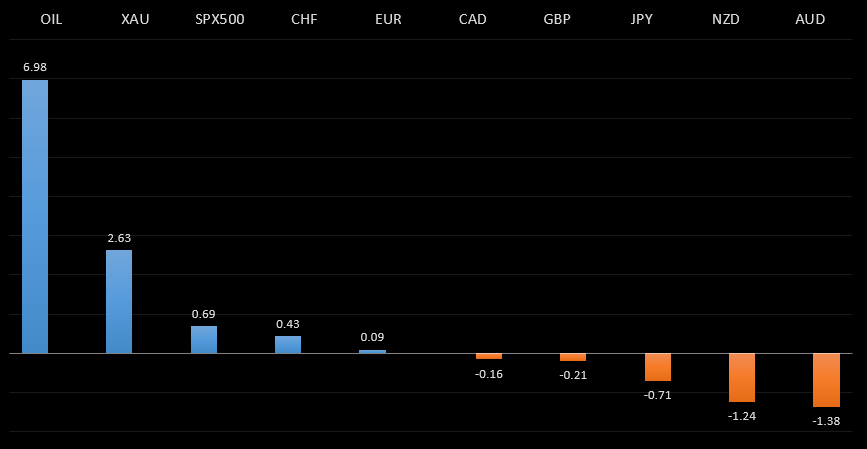
Peformance chart: 30 Day Performance vs. US dollar (%)
Suggested reading
- Bond Front Runners Don't Care About Inflation, J. Authers, Bloomberg (June 10, 2021)
- He Won The $4.3 Trillion Mortgage Market, A. Gara, Forbes (June 8, 2021)
Chart talk: Technical & fundamental highlights
Choose pair:
EURUSD – technical overview
The market has been looking for a higher low since topping out in 2021 up at 1.2350. Ideally, this next higher low is sought out ahead of 1.1600 in favour of the next major upside extension back through 1.2350 and towards a retest of the 2018 high at 1.2555 further up.EURUSD – fundamental overview
Data out of the Eurozone has been less impressive this week, which has been weighing on the Euro into any rallies. The latest discouraging data comes from Wednesday's weaker German trade. Looking ahead, key standouts on the calendar come in the form of the ECB policy decision (no change expected), US initial jobless claims and US inflation data.EURUSD - Technical charts in detail
GBPUSD – technical overview
Technical studies are in the process of consolidating from stretched levels after the push to fresh multi-month highs. This leaves room for additional consolidation, before the market considers a meaningful bullish continuation towards a retest of the 2018 high. But look for setbacks to now be very well supported into the 1.3500 area.GBPUSD – fundamental overview
The Pound has been trading lower as the EU warns of trade tariffs if the UK fails to implement Brexit with Northern Ireland. Meanwhile, Andy Haldane, soon to be former economist for the BOE, hasn't been helping the Pound, talking about a dangerous moment for monetary policy and that the balance of risk has shifted decisively. Looking ahead, key standouts on the calendar come in the form of the ECB policy decision (no change expected), US initial jobless claims and US inflation data.USDJPY – technical overview
The major pair has run into massive resistance in the form of the monthly Ichimoku cloud, and has since stalled out. This translates to a longer-term trend that is still bearish despite the run up we saw in 2021, with risk for deeper setbacks ahead. It would take a clear break back above 113.00 to negate the outlook.USDJPY – fundamental overview
The market hasn't been loving what it's been hearing from PM Suga, who sounds desperate when saying Japan will use reserves and unused budget for economic support. Looking ahead, key standouts on the calendar come in the form of the ECB policy decision (no change expected), US initial jobless claims and US inflation data.AUDUSD – technical overview
Technical studies have turned up in recent months, after the market traded down to its lowest levels since 2003 in 2020. There is evidence of a longer-term bottom following the latest push back through 0.7000, though at this stage, there is risk for a deeper pullback to allow for shorter term studies to unwind. Setbacks should now be well supported ahead of 0.7400.AUDUSD – fundamental overview
The Australian Dollar has held up relatively well over the past 24 hours, getting a boost from rising iron ore. Consensus is now growing for an RBA taper next month. Looking ahead, key standouts on the calendar come in the form of the ECB policy decision (no change expected), US initial jobless claims and US inflation data.USDCAD – technical overview
Has been in major decline since topping out in 2021 above 1.4600. At this stage, with the decline now well extended, the market is likely to find solid support into the 1.2000 area ahead of a resumption of gains. Ultimately, only a weekly close below 1.2000 would suggest otherwise. Back above 1.2352 will strengthen the outlook.USDCAD – fundamental overview
The Canadian Dollar has held steady in the aftermath of the latest hold by the Bank of Canada. The central bank hinted at more tapering at the July meeting, while signaling an end of QE in early 2022. The futures market is now pricing a 70% chance for a rate hike next year and three hikes by the end of 2023. Canada is also aiming for an early July lifting of the quarantine. Looking ahead, key standouts on the calendar come in the form of the ECB policy decision (no change expected), US initial jobless claims and US inflation data.NZDUSD – technical overview
The market has been very well supported in recent months and there is evidence of a longer-term base. Look for setbacks to hold up above 0.7100, with sights set on a run back towards the 0.7500 area.NZDUSD – fundamental overview
The New Zealand Dollar took a hit on Wednesday after ANZ business confidence reads unexpectedly fell. Looking ahead, key standouts on the calendar come in the form of the ECB policy decision (no change expected), US initial jobless claims and US inflation data.US SPX 500 – technical overview
Longer-term technical studies are looking quite exhausted and the market is showing signs of wanting to roll over after racing to another record high. Look for rallies to be well capped above of 4200, with a break back below 4000 to strengthen the outlook.US SPX 500 – fundamental overview
We're trading just off fresh record highs, and yet, with so little room for additional central bank accommodation, given an already depressed interest rate environment, the prospect for sustainable runs to the topside on easy money policy incentives and government stimulus, should no longer be as enticing to investors. Meanwhile, ongoing worry associated with coronavirus fallout and risk of rising inflation should weigh more heavily on investor sentiment into the second half of 2021.GOLD (SPOT) – technical overview
The 2019 breakout above the 2016 high at 1375 was a significant development, opening the door for fresh record highs and an acceleration beyond the next major psychological barrier at 2000. Setbacks should now be well supported above 1600.GOLD (SPOT) – fundamental overview
The yellow metal continues to be well supported on dips with solid demand from medium and longer-term accounts. These players are more concerned about exhausted monetary policy, extended global equities, and coronavirus fallout. All of this should keep the commodity well supported, with many market participants also fleeing to the hard asset as the grand dichotomy of record high equities and record low yields comes to an unnerving climax.