


Next 24 hours: US Dollar races higher post FOMC
Today’s report: Daggers all around
It was daggers for risk markets all around in the aftermath of Wednesday’s Fed decision. There was some thought that given all of the hawkish expectations heading in to the event risk and given the recent downside pressure in stocks, the Fed would lighten up on its hawkish communication.
Wake-up call
- ECB Simkus
- IMF comments
- BOJ Minutes
- post Fed
- BoC decision
- Spencer comments
- Stocks vulnerable
- Dealers report
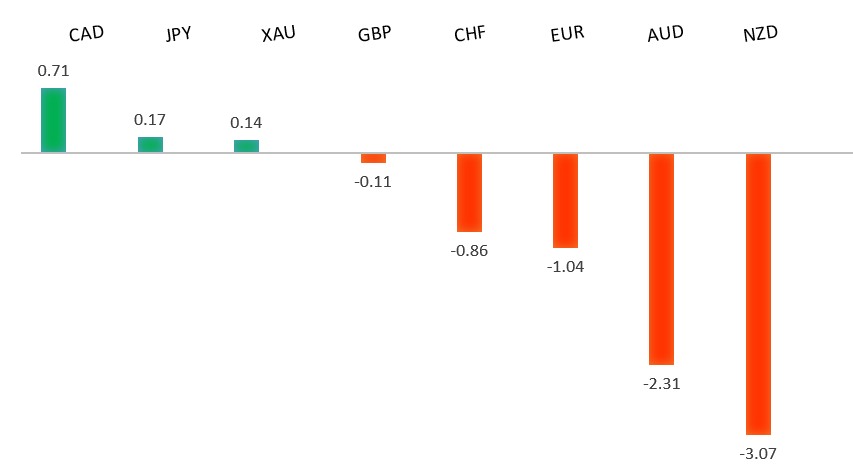
Peformance chart: 30 Day Performance vs. US dollar (%)
Suggested reading
- Stock Markets Don’t Like Listening to Jay Powell, J. Authers, Bloomberg (January 27, 2022)
- International Investors in Chinese Companies Face Growing Risks, J. Kynge, Financial Times (January 26, 2022)
Chart talk: Technical & fundamental highlights
Choose pair:
EURUSD – technical overview
Setbacks have extended to retest the critical 61.8% fib retrace off the 2020 low to 2021 high move. Technical studies are now turning up from extended territory on the weekly chart, warning of the need for an additional corrective bounce ahead. Look for the market to hold up on a weekly close basis above the 61.8% fib retrace around 1.1275. Weekly close back above 1.1500 strengthens outlook. Weekly close below 1.1275 negates.EURUSD – fundamental overview
Most of the downside pressure on the Euro comes from the US Dollar side of the equation, with yield differentials becoming that much more favourable to the US Dollar in the aftermath of the Fed decision. Meanwhile, the ECB's Simkus warned the Eurozone economy will see a significant economic hit if tensions between Russia and Ukraine escalator further. Key standouts on today’s calendar come in the form of US reads highlighted by GDP, durable goods, initial jobless claims, and pending home sales.EURUSD - Technical charts in detail
GBPUSD – technical overview
The market is in a correction phase in the aftermath of the run to fresh multi-month highs in 2021. At this stage, additional setbacks should be limited to the 1.3000 area ahead of the next major upside extension towards a retest and break of critical resistance in the form of the 2018 high. Back above 1.3835 takes pressure off the downside.GBPUSD – fundamental overview
The Pound has held up relatively well against its peers, but hasn't been able to avoid weakness against the US Dollar in the aftermath of the hawkish FOMC decision. Key standouts on today’s calendar come in the form of US reads highlighted by GDP, durable goods, initial jobless claims, and pending home sales.USDJPY – technical overview
The longer-term trend is bearish despite the recent run higher. Look for additional upside to be limited, with scope for a topside failure and bearish resumption back down towards the 100.00 area. It would take a clear break back above 116.00 to negate the outlook.USDJPY – fundamental overview
A recent round of intense risk off flow in US equities has mostly contributed to the latest wave of Yen demand. At the same time, the broad based round of US Dollar strength has contributed to some offsetting flow. The Bank of Japan January meeting minutes showed that several policymakers saw the need to keep easing in place and to communicate a firm stance on central bank policy. Key standouts on today’s calendar come in the form of US reads highlighted by GDP, durable goods, initial jobless claims, and pending home sales.AUDUSD – technical overview
The Australian Dollar has been in the process of a healthy correction following the impressive run towards a retest of the 2018 high in 2021. At this stage, the correction is starting to look stretched and setbacks should be well supported above 0.7000 on a weekly close basis. A weekly close below 0.7000 will force a bearish shift.AUDUSD – fundamental overview
The Australian Dollar hasn't been able to avoid the wave of risk off flow in global markets in the aftermath of the more hawkish FOMC decision. Key standouts on today’s calendar come in the form of US reads highlighted by GDP, durable goods, initial jobless claims, and pending home sales.USDCAD – technical overview
Finally signs of a major bottom in the works after a severe decline from the 2020 high. A recent weekly close back above 1.2500 encourages the constructive outlook and opens the door for a push back towards next critical resistance in the 1.3000 area. Any setbacks should be well supported into the 1.2200s.USDCAD – fundamental overview
The Bank of Canada kept its benchmark rate unchanged, raised its 2022 inflation forecast to 4.2% and said the Canadian economy is at full capacity. The central bank also signaled further hikes could be imminent, and Governor Macklem later said 'everyone should expect interest rates to be on a rising path.' Still, there were many expecting a hike on Wednesday and this left the overall tone less hawkish, which weighed on the Loonie, especially in the aftermath of a hawkish FOMC decision. Key standouts on today’s calendar come in the form of US reads highlighted by GDP, durable goods, initial jobless claims, and pending home sales.NZDUSD – technical overview
The market has entered a period of intense correction after running up to a yearly and multi-month high. Back below 0.6500 would suggest a more significant bearish structural shift.NZDUSD – fundamental overview
Former RBNZ policymaker Spencer sees the RBNZ raising 5 times this year to 2.00%. But this hasn't done anything to help the New Zealand Dollar. The currency has been dragged lower on the back of broad based risk off flow. Key standouts on today’s calendar come in the form of US reads highlighted by GDP, durable goods, initial jobless claims, and pending home sales.US SPX 500 – technical overview
Longer-term technical studies are in the process of unwinding from extended readings off record highs. The latest breakdown below 4,272 opens the door for the next major downside extension towards 3,500. Back above 4,612 will be required at a minimum to take the immediate pressure off the downside.US SPX 500 – fundamental overview
With so little room for additional central bank accommodation, given an already depressed interest rate environment, the prospect for sustainable runs to the topside on easy money policy incentives and government stimulus, should no longer be as enticing to investors. Meanwhile, ongoing worry associated with coronavirus fallout and risk of rising inflation should weigh more heavily on investor sentiment in Q1 2022.GOLD (SPOT) – technical overview
The 2019 breakout above the 2016 high at 1375 was a significant development, opening the door for fresh record highs and an acceleration beyond the next major psychological barrier at 2000. Setbacks should now be well supported above 1600.GOLD (SPOT) – fundamental overview
The yellow metal continues to be well supported on dips with solid demand from medium and longer-term accounts. These players are more concerned about exhausted monetary policy, extended global equities, and coronavirus fallout. All of this should keep the commodity well supported, with many market participants also fleeing to the hard asset as the grand dichotomy of record high equities and record low yields comes to an unnerving climax.