


Next 24 hours: Not a pretty picture
Today’s report: Russia move cripples financial markets
It's all about risk off flow and safe haven bids into the US Dollar on Thursday, this after Russian President Putin announced a "military operation" in Ukraine. Clearly global markets are extremely sensitive to the escalation of the crisis, which could open the door to a lot more uncertainty going forward.
Wake-up call
- turns south
- risk off
- Traditional correlations
- commodities run
- Rocketing oil
- already fading
- Stocks vulnerable
- Dealers report
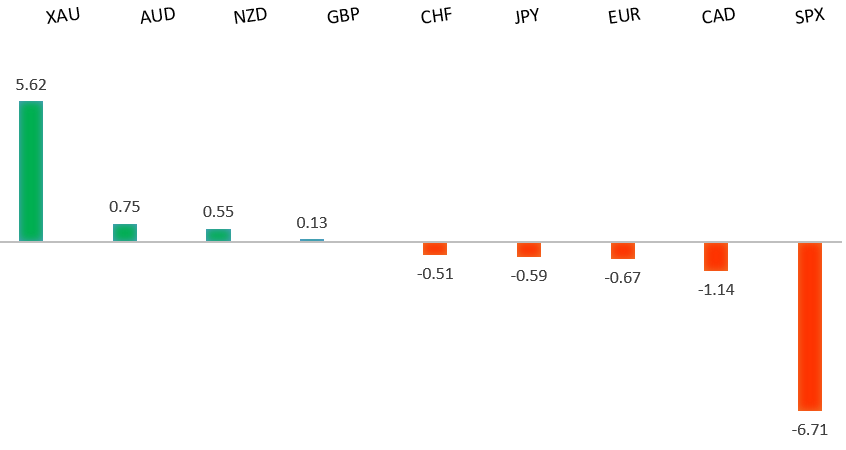
Peformance chart: 30 Day Performance vs. US dollar (%)
Suggested reading
- A Stock Correction Doesn't Mean the Market Was Wrong, R. Burgess, Bloomberg (February 24, 2022)
- Mark Zuckerberg Is No Steve Jobs, B. Lefsetz, The Big Picture (February 20, 2022)
Chart talk: Technical & fundamental highlights
Choose pair:
EURUSD – technical overview
The market has been confined to a choppy consolidation, mostly between 1.1200 and 1.1500. A clear break back above 1.1500 will suggest the market could be getting ready to turn back up. Back below 1.1200 will set up the next major downside extension to fresh multi-month lows below 1.1000.EURUSD – fundamental overview
It's all about risk off flow and safe haven bids into the US Dollar on Thursday, this after Russian President announced a "military operation" in Ukraine's Donbas region. Key standouts on today’s calendar come in the form of US GDP, initial jobless claims, new home sales, and Fed speak.EURUSD - Technical charts in detail
GBPUSD – technical overview
The market is in a correction phase in the aftermath of the run to fresh multi-month highs in 2021. At this stage, additional setbacks should be limited to the 1.3000 area ahead of the next major upside extension towards a retest and break of critical resistance in the form of the 2018 high. Back above 1.3835 takes pressure off the downside.GBPUSD – fundamental overview
It's all about risk off flow and safe haven bids into the US Dollar on Thursday, this after Russian President announced a "military operation" in Ukraine's Donbas region. Key standouts on today’s calendar come in the form of US GDP, initial jobless claims, new home sales, and Fed speak.USDJPY – technical overview
The longer-term trend is bearish despite the recent run higher. Look for additional upside to be limited, with scope for a topside failure and bearish resumption back down towards the 100.00 area. It would take a clear break back above 117.00 to negate the outlook.USDJPY – fundamental overview
It's all about risk off flow and safe haven bids on Thursday, this after Russian President announced a "military operation" in Ukraine's Donbas region. Give the Yen's correlation with risk off and flight to safety, we are seeing Yen demand as a consequence. Key standouts on today’s calendar come in the form of US GDP, initial jobless claims, new home sales, and Fed speak.AUDUSD – technical overview
The Australian Dollar has been in the process of a healthy correction following the impressive run towards a retest of the 2018 high in 2021. At this stage, the correction is starting to look stretched and setbacks should be well supported above 0.7000 on a weekly close basis. A weekly close below 0.7000 will force a bearish shift.AUDUSD – fundamental overview
It's all about risk off flow and safe haven bids into the US Dollar on Thursday, this after Russian President announced a "military operation" in Ukraine's Donbas region. All of this more than offsetting any positive flow from the rally in commodities. Key standouts on today’s calendar come in the form of US GDP, initial jobless claims, new home sales, and Fed speak.USDCAD – technical overview
Finally signs of a major bottom in the works after a severe decline from the 2020 high. A recent weekly close back above 1.2500 encourages the constructive outlook and opens the door for a push back towards next critical resistance in the 1.3000 area. Any setbacks should be well supported into the 1.2200s.USDCAD – fundamental overview
It's all about risk off flow and safe haven bids into the US Dollar on Thursday, this after Russian President announced a "military operation" in Ukraine's Donbas region. All of this more than offsetting any positive flow into the Canadian Dollar from surging oil. Key standouts on today’s calendar come in the form of US GDP, initial jobless claims, new home sales, and Fed speak.NZDUSD – technical overview
Setbacks have intensified in recent weeks with the market trading down to fresh multi-month lows. A recent breakdown below the 0.6700 area opens the door for a drop towards 0.6500 in the sessions ahead.NZDUSD – fundamental overview
It's all about risk off flow and safe haven bids into the US Dollar on Thursday, this after Russian President announced a "military operation" in Ukraine's Donbas region. All of this is more than offsetting Wednesday's hawkish RBNZ and this latest run in commodities. Key standouts on today’s calendar come in the form of US GDP, initial jobless claims, new home sales, and Fed speak.US SPX 500 – technical overview
Longer-term technical studies are in the process of unwinding from extended readings off record highs. The latest breakdown below 4,272 opens the door for the next major downside extension towards 3,500. Back above 4,612 will be required at a minimum to take the immediate pressure off the downside.US SPX 500 – fundamental overview
With so little room for additional central bank accommodation, given an already depressed interest rate environment, the prospect for sustainable runs to the topside on easy money policy incentives and government stimulus, should no longer be as enticing to investors. Meanwhile, ongoing worry associated with coronavirus fallout, rising inflation, and geopolitical tension should weigh more heavily on investor sentiment in Q1 2022.GOLD (SPOT) – technical overview
The 2019 breakout above the 2016 high at 1375 was a significant development, opening the door for fresh record highs and an acceleration beyond the next major psychological barrier at 2000. Setbacks should now be well supported above 1700.GOLD (SPOT) – fundamental overview
The yellow metal continues to be well supported on dips with solid demand from medium and longer-term accounts. These players are more concerned about exhausted monetary policy, extended global equities, coronavirus fallout, and geopolitical tension. All of this should keep the commodity well supported, with many market participants also fleeing to the hard asset as the grand dichotomy of record high equities and record low yields comes to an unnerving climax.