


Next 24 hours: Why the recovery in risk appetite?
Today’s report: Geopolitical risk and end of month flows
We’ve seen the Euro struggling to hold onto gains and trading just off recent multi-month lows on the back of the latest escalation out of the Ukraine, given the expected impact on Eurozone growth.
Wake-up call
- Economic fallout
- GBPUSD UK inflation running hot
- Yen sold
- commodities run
- diverging flow
- retail sales
- Stocks vulnerable
- Dealers report
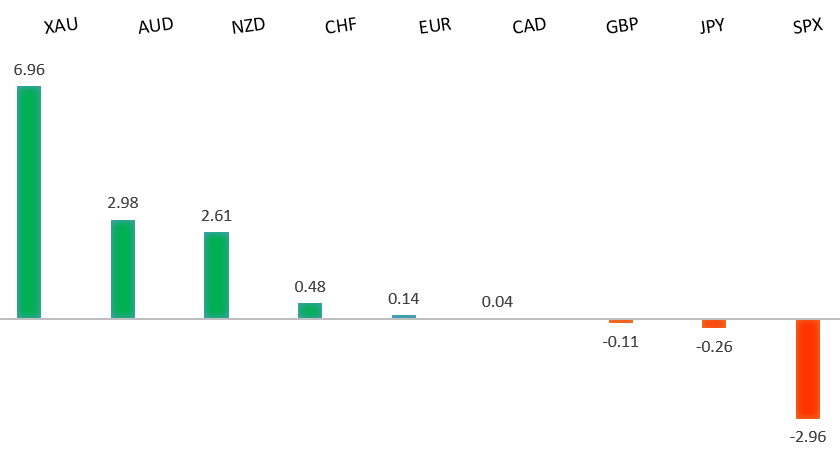
Peformance chart: 30 Day Performance vs. US dollar (%)
Suggested reading
- Why Are We Surprised That Sanctions Keep Failing?, J. Paris, Bloomberg (February 25, 2022)
- Russia's invasion of Ukraine: what next?, G. Rachman, Financial Times (February 26, 2022)
Chart talk: Technical & fundamental highlights
Choose pair:
EURUSD – technical overview
The market has been confined to a choppy consolidation, between 1.1100 and 1.1500. A clear break back above 1.1500 will suggest the market could be getting ready to turn back up. Back below 1.1100 will set up the next major downside extension to fresh multi-month lows below 1.1000 towards the multi-year low from 2020 in the 1.0600 area.EURUSD – fundamental overview
We’ve been seeing some attempts at buying the Euro into dips, with broad US Dollar selling and end of month flows factoring into the price action. Having said that, there are concerns about the impact of the Ukraine war on growth. Key standouts on today’s calendar come in the form of Canada producer prices, Chicago PMIs, Dallas Fed manufacturing, and an ECB Lagarde speech.EURUSD - Technical charts in detail
GBPUSD – technical overview
The market is in a correction phase in the aftermath of the run to fresh multi-month highs in 2021. At this stage, additional setbacks should be limited to the 1.3000 area ahead of the next major upside extension towards a retest and break of critical resistance in the form of the 2018 high. Back above 1.3835 takes pressure off the downside.GBPUSD – fundamental overview
Surging gas prices are seen pushing UK CPI towards 8%, which should put more pressure on the BOE to raise rates. BOE Mann has added to this saying research supports the front-loading of hikes amidst uncertainty. Key standouts on today’s calendar come in the form of Canada producer prices, Chicago PMIs, Dallas Fed manufacturing, and an ECB Lagarde speech.USDJPY – technical overview
The longer-term trend is bearish despite the recent run higher. Look for additional upside to be limited, with scope for a topside failure and bearish resumption back down towards the 100.00 area. It would take a clear break back above 117.00 to negate the outlook.USDJPY – fundamental overview
We’ve seen a bit of an unwinding of the safe haven trade as the week gets going, which has factored into some of the latest offers in the Yen. Key standouts on today’s calendar come in the form of Canada producer prices, Chicago PMIs, Dallas Fed manufacturing, and an ECB Lagarde speech.AUDUSD – technical overview
The Australian Dollar has been in the process of a healthy correction following the impressive run towards a retest of the 2018 high in 2021. At this stage, the correction is starting to look stretched and setbacks should be well supported above 0.7000 on a weekly close basis. A weekly close below 0.7000 will force a bearish shift.AUDUSD – fundamental overview
Commodities prices are running strong and risk appetite is on the uptick as tensions fade a little on the geopolitical front. This has helped to keep Aussie supported in recent sessions. Key standouts on today’s calendar come in the form of Canada producer prices, Chicago PMIs, Dallas Fed manufacturing, and an ECB Lagarde speech.USDCAD – technical overview
Finally signs of a major bottom in the works after a severe decline from the 2020 high. A recent weekly close back above 1.2500 encourages the constructive outlook and opens the door for a push back towards next critical resistance in the 1.3000 area. Any setbacks should be well supported into the 1.2200s.USDCAD – fundamental overview
The Canadian Dollar has been caught between flows, with demand for the Loonie coming from surging oil prices, but offers coming in on the back of the less certain risk outlook. Key standouts on today’s calendar come in the form of Canada producer prices, Chicago PMIs, Dallas Fed manufacturing, and an ECB Lagarde speech.NZDUSD – technical overview
Setbacks have intensified in recent weeks with the market trading down to fresh multi-month lows. A recent breakdown below the 0.6700 area opens the door for a drop towards 0.6500 in the sessions ahead.NZDUSD – fundamental overview
The New Zealand Dollar got a nice boost at the end of last week after retail sales came in better than expected. At the same time, the less certain risk outlook has been capping gains into rallies. Key standouts on today’s calendar come in the form of Canada producer prices, Chicago PMIs, Dallas Fed manufacturing, and an ECB Lagarde speech.US SPX 500 – technical overview
Longer-term technical studies are in the process of unwinding from extended readings off record highs. The latest breakdown below 4,272 opens the door for the next major downside extension towards 3,500. Back above 4,612 will be required at a minimum to take the immediate pressure off the downside.US SPX 500 – fundamental overview
With so little room for additional central bank accommodation, given an already depressed interest rate environment, the prospect for sustainable runs to the topside on easy money policy incentives and government stimulus, should no longer be as enticing to investors. Meanwhile, ongoing worry associated with coronavirus fallout, rising inflation, and geopolitical tension should weigh more heavily on investor sentiment in Q1 2022.GOLD (SPOT) – technical overview
The 2019 breakout above the 2016 high at 1375 was a significant development, opening the door for fresh record highs and an acceleration beyond the next major psychological barrier at 2000. Setbacks should now be well supported above 1700.GOLD (SPOT) – fundamental overview
The yellow metal continues to be well supported on dips with solid demand from medium and longer-term accounts. These players are more concerned about exhausted monetary policy, extended global equities, coronavirus fallout, and geopolitical tension. All of this should keep the commodity well supported, with many market participants also fleeing to the hard asset as the grand dichotomy of record high equities and record low yields comes to an unnerving climax.