


Next 24 hours: Month end portfolio rebalancing
Today’s report: Corporate buybacks sound nice
It seems the stock market has been able to overlook the surge in rates, at least for now, while it shifts its attention to a huge corporate buyback schedule. Investors have also been less stressed about Russia and the Ukraine, especially with chatter of a breakthrough on the horizon.
Wake-up call
- Market pricing
- BOE Bailey
- JGB yields
- Robust employment
- Consumer confidence
- Discouraging jobs
- Stocks vulnerable
- Dealers report
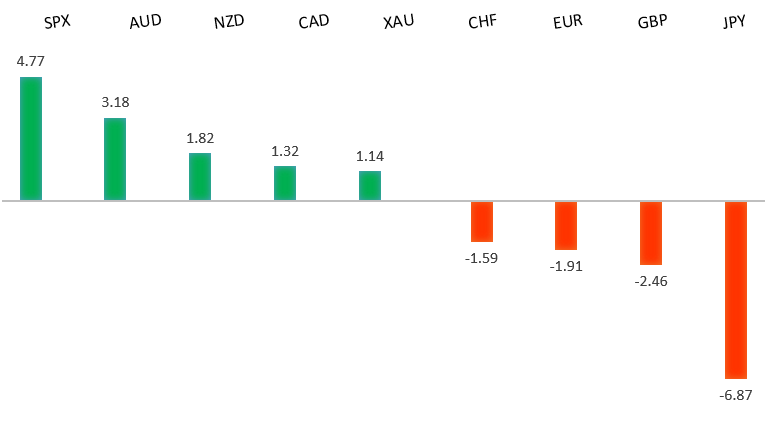
Peformance chart: 30 Day Performance vs. US dollar (%)
Suggested reading
- Not All Yield Curve Inversions Are Fatal, J. Authers, Bloomberg (March 29, 2022)
- China, Russia and the war in Ukraine, J. Kynge, Financial Times (March 24, 2022)
Chart talk: Technical & fundamental highlights
Choose pair:
EURUSD – technical overview
The latest breakdown below 1.1100 to fresh multi-month lows now sets up the next major downside extension below 1.1000 towards the multi-year low from 2020 in the 1.0600 area. At this stage, it will take a push back above 1.1500 to force a shift in the outlook.EURUSD – fundamental overview
The Euro remains weighed down on yield differentials despite modest support from rising rate expectations for the ECB. The market is pricing 100bps of ECB hikes over the next 12 months. Key standouts on today’s calendar come from German confidence reads, UK consumer credit, the BOE Quarterly Bulletin, US Case Shiller, JOLTs job openings, and consumer confidence.EURUSD - Technical charts in detail
GBPUSD – technical overview
The market is in a correction phase in the aftermath of the run to fresh multi-month highs in 2021. At this stage, additional setbacks should be limited to the 1.3000 area ahead of the next major upside extension towards a retest and break of critical resistance in the form of the 2018 high. Back above 1.3835 takes pressure off the downside.GBPUSD – fundamental overview
The Pound has underperformed in recent trade after the BOE went soft on the inflation outlook. BOE Bailey was out talking risks to inflation on both sides, while expressing worry around the energy shock to incomes. Key standouts on today’s calendar come from German confidence reads, UK consumer credit, the BOE Quarterly Bulletin, US Case Shiller, JOLTs job openings, and consumer confidence.USDJPY – technical overview
The market has rocketed higher to fresh multi-month highs and is now staring at a retest of the critical peak from 2015 up ahead of 126.00. Technical studies are however quite extended, with scope for a sizable correction in the weeks ahead.USDJPY – fundamental overview
The Yen continues to get hammered to multi-month lows, with the worsening terms of trade and widening yield differentials with the US Dollar playing a major part. Moreover, the fact that stocks have been resilient, is taking away from any Yen demand we might normally see in a risk off backdrop, further intensifying Yen outflows. The latest move comes after the BOJ intervened to cap the rise in JGB yields. The BOJ is increasing QE, while other central banks going the other way. Key standouts on today’s calendar come from German confidence reads, UK consumer credit, the BOE Quarterly Bulletin, US Case Shiller, JOLTs job openings, and consumer confidence.AUDUSD – technical overview
At this stage, the market has found a bottom and is trying to work back to the topside. Ultimately, it will take a break back above 0.7600 to shift the focus back on the topside. A weekly close below 0.7000 will force a bearish shift.AUDUSD – fundamental overview
The global commodities trade has faltered just a little bit, which has opened some selling of the Australian Dollar into this latest run higher. At the same time, Aussie has been well supported on dips on the robust employment outlook. Key standouts on today’s calendar come from German confidence reads, UK consumer credit, the BOE Quarterly Bulletin, US Case Shiller, JOLTs job openings, and consumer confidence.USDCAD – technical overview
Signs of a major bottom in the works after a severe decline from the 2020 high. A recent weekly close back above 1.2500 encourages the constructive outlook and opens the door for a push back towards next critical resistance in the 1.3000 area. Any setbacks should be well supported into the 1.2200s.USDCAD – fundamental overview
Some weakness in the Canadian Dollar to start the week after another big rally. The reversal of flow comes from the retreat in the price of oil and drop in Canada consumer confidence to a 14-month low. Key standouts on today’s calendar come from German confidence reads, UK consumer credit, the BOE Quarterly Bulletin, US Case Shiller, JOLTs job openings, and consumer confidence.NZDUSD – technical overview
Setbacks have intensified in recent weeks with the market trading down to fresh multi-month lows. A recent breakdown below the 0.6700 area opens the door for a drop towards 0.6500 in the sessions ahead.NZDUSD – fundamental overview
The New Zealand Dollar sold off hard on Monday, taking a hit from a weak jobs report out of New Zealand and this latest slide in commodities prices. Key standouts on today’s calendar come from German confidence reads, UK consumer credit, the BOE Quarterly Bulletin, US Case Shiller, JOLTs job openings, and consumer confidence.US SPX 500 – technical overview
Longer-term technical studies are in the process of unwinding from extended readings off record highs. Look for rallies to be well capped in favor of lower tops and lower lows. Back above 4,600 will be required at a minimum to take the immediate pressure off the downside.US SPX 500 – fundamental overview
With so little room for additional central bank accommodation, given an already depressed interest rate environment, the prospect for sustainable runs to the topside on easy money policy incentives and government stimulus, should no longer be as enticing to investors. Meanwhile, ongoing worry associated with coronavirus fallout, rising inflation, and geopolitical tension should weigh more heavily on investor sentiment in Q1 2022.GOLD (SPOT) – technical overview
The 2019 breakout above the 2016 high at 1375 was a significant development, opening the door for fresh record highs. Setbacks should now be well supported above 1900.GOLD (SPOT) – fundamental overview
The yellow metal continues to be well supported on dips with solid demand from medium and longer-term accounts. These players are more concerned about exhausted monetary policy, extended global equities, coronavirus fallout, inflation risk, and geopolitical tension. All of this should keep the commodity well supported, with many market participants also fleeing to the hard asset as the grand dichotomy of record high equities and record low yields comes to an unnerving climax.