


Special report: BOE policy decision preview
Today’s report: As the dust settles
As we highlighted in our FOMC preview special report from Wednesday, the balance of risk was tilted heavily in favor of a reversal of flow, with the US Dollar seen at risk of selling off and US equities projected to rally.
Wake-up call
- Yield differentials
- FOMC reaction
- Risk on
- local data
- macro flows
- renewed appetite
- Stocks vulnerable
- Dealers report
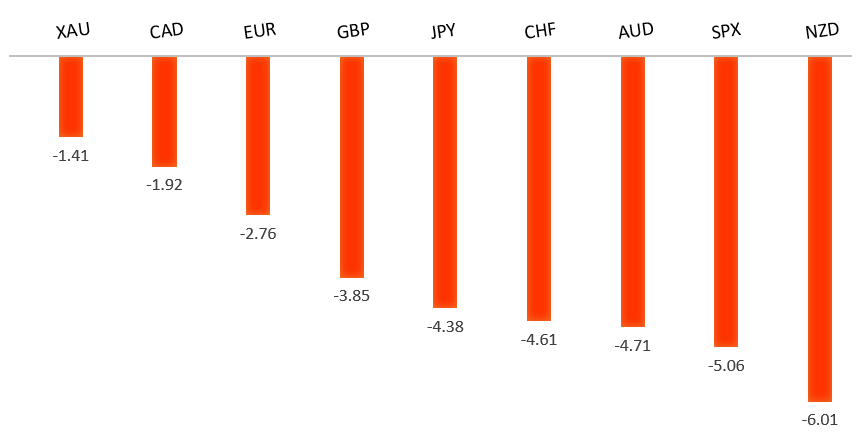
Peformance chart: 30 Day Performance vs. US dollar (%)
Suggested reading
- Dreams of a Soft Landing, Fears of Hard Retirement, J. Authers, Bloomberg (May 5, 2022)
- Highlights from the FT's Crypto and Digital Assets Summit, Financial Times (May 4, 2022)
Chart talk: Technical & fundamental highlights
Choose pair:
EURUSD – technical overview
A recent breakdown below 1.1100 to fresh multi-month lows now sets up the next major downside extension towards the multi-year low from 2017 in the 1.0300 area. At this stage, it will take a push back above 1.1500 to force a shift in the outlook.EURUSD – fundamental overview
The Euro got a big boost on Wednesday as the market sold US Dollars on the fact of the Fed decision. While the Fed did indeed go ahead with its first 50 basis point rate hike in over two decades, and announced it would begin reducing its balance sheet in June, Fed Powell saying the central bank wasn't actively seeking a 75 basis point hike was enough to inspire profit taking on US Dollar longs. Meanwhile, hawkish talk out of the ECb has been ramping up, with many officials talking about a possible rate hike on the horizon. Key standouts on today’s calendar come from German factory orders, PMI reads out of Germany, the Eurozone and UK, an ECB Lane speech, the BOE policy decision, and US initial jobless claims.EURUSD - Technical charts in detail
GBPUSD – technical overview
The market is in a correction phase in the aftermath of the run to fresh multi-month highs in 2021. At this stage, additional setbacks should be limited to the 1.2500 area ahead of the next major upside extension towards a retest and break of critical resistance in the form of the 2018 high. Back above 1.3148 takes immediate pressure off the downside.GBPUSD – fundamental overview
The Pound got a big boost on Wednesday as the market sold US Dollars on the fact of the Fed decision. While the Fed did indeed go ahead with its first 50 basis point rate hike in over two decades, and announced it would begin reducing its balance sheet in June, Fed Powell saying the central bank wasn't actively seeking a 75 basis point hike was enough to inspire profit taking on US Dollar longs. Attention now shifts to today's BOE decision. Key standouts on today’s calendar come from German factory orders, PMI reads out of Germany, the Eurozone and UK, an ECB Lane speech, the mentioned BOE policy decision, and US initial jobless claims.USDJPY – technical overview
The market has rocketed higher to its highest levels since 2002 after breaking through the 2015 high. Technical studies are however quite extended, with scope for a sizable correction in the weeks ahead. Look for additional upside from here to be limited to the 130.00 area for now.USDJPY – fundamental overview
Broad based US Dollar selling in the aftermath of the 'sell US Dollars on the fact' Fed decision has inspired some Yen demand. At the same time, Yen upside has been limited with the currency finding offers on account of the resulting wave of risk of flow. Key standouts on today’s calendar come from German factory orders, PMI reads out of Germany, the Eurozone and UK, an ECB Lane speech, the BOE policy decision, and US initial jobless claims.AUDUSD – technical overview
At this stage, the market has found a bottom and is trying to hold up into dips. Still, the overall pressure remains on the downside and ultimately, it will take a weekly close back above 0.7600 to officially shift the focus back on the topside.AUDUSD – fundamental overview
The Australian Dollar was already doing a good job with a recovery after Tuesday's Aussie retail sales came out strong. This was followed up by more Aussie buying on account of broad based US Dollar weakness in the aftermath of the 'sell the US Dollar on the fact' Fed policy decision. Key standouts on today’s calendar come from German factory orders, PMI reads out of Germany, the Eurozone and UK, an ECB Lane speech, the BOE policy decision, and US initial jobless claims.USDCAD – technical overview
Signs of a major bottom in the works after a severe decline from the 2020 high. A recent weekly close back above 1.2500 encourages the constructive outlook and opens the door for a push back towards next critical resistance in the 1.3000 area. Any setbacks should be well supported into the 1.2200s.USDCAD – fundamental overview
The Canadian Dollar has extended its recent recovery on the back of post FOMC broad based US Dollar selling and a concurrent rebound in risk assets and commodities prices. Key standouts on today’s calendar come from German factory orders, PMI reads out of Germany, the Eurozone and UK, an ECB Lane speech, the BOE policy decision, and US initial jobless claims.NZDUSD – technical overview
The market has been trending lower since topping out in 2021, making a series of lower highs and lower lows. Look for the latest recovery rally to set up the next lower top for a bearish continuation below 0.6500 and towards 0.6000. Back above 0.7200 would be required to negate and force a shift in the structure.NZDUSD – fundamental overview
The New Zealand Dollar has extended its recent recovery on the back of post FOMC broad based US Dollar selling and a concurrent rebound in risk assets and commodities prices. Key standouts on today’s calendar come from German factory orders, PMI reads out of Germany, the Eurozone and UK, an ECB Lane speech, the BOE policy decision, and US initial jobless claims.US SPX 500 – technical overview
Longer-term technical studies are in the process of unwinding from extended readings off record highs. Look for rallies to be well capped in favor of lower tops and lower lows. Back above 4,312 will be required at a minimum to take the immediate pressure off the downside. Below 4000 opens next downside extension.US SPX 500 – fundamental overview
With so little room for additional central bank accommodation, given an already depressed interest rate environment, the prospect for sustainable runs to the topside on easy money policy incentives and government stimulus, should no longer be as enticing to investors. Meanwhile, ongoing worry associated with coronavirus fallout, rising inflation, and geopolitical tension should weigh more heavily on investor sentiment in Q2 2022.GOLD (SPOT) – technical overview
The 2019 breakout above the 2016 high at 1375 was a significant development, opening the door for fresh record highs. Setbacks should now be well supported above 1800.GOLD (SPOT) – fundamental overview
The yellow metal continues to be well supported on dips with solid demand from medium and longer-term accounts. These players are more concerned about exhausted monetary policy, extended global equities, coronavirus fallout, inflation risk, and geopolitical tension. All of this should keep the commodity well supported, with many market participants also fleeing to the hard asset as the grand dichotomy of record high equities and record low yields comes to an unnerving climax.