


Next 24 hours: Data light calendar puts bigger picture themes in focus
Today’s report: Not the jobs report investors wanted
If investors were looking for a softer US jobs report to help the cause, they weren’t going to get it. Friday’s jobs report came in better than expected, which didn’t do anything to suggest the Fed should be halting the brakes on its monetary policy normalization timeline.
Wake-up call
- retail sales
- holiday break
- deflation worry
- housing market
- hawkish talk
- risk off
- Stocks vulnerable
- Dealers report
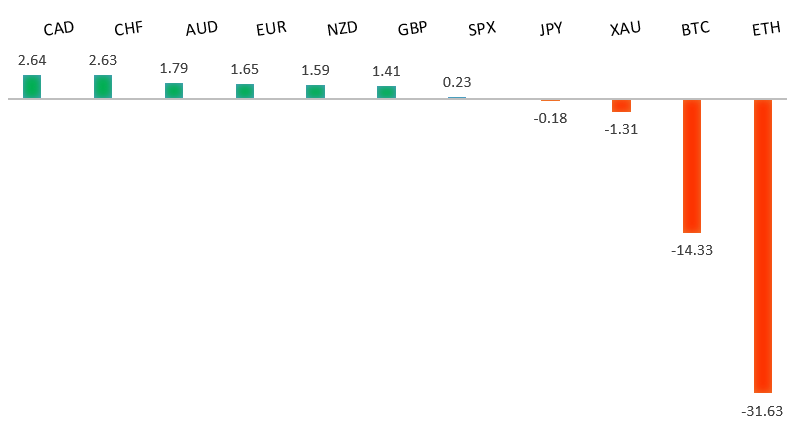
Peformance chart: 30 Day Performance vs. US dollar (%)
Suggested reading
- The Path to a Soft Landing Is Getting a Little Easier, J. Authers, Bloomberg (June 6, 2022)
- Learning to Love 5G and Beyond, A. Gross, Financial Times (June 6, 2022)
Chart talk: Technical & fundamental highlights
Choose pair:
EURUSD – technical overview
The market has come under intense pressure in recent weeks, with setbacks accelerating to retest the multi-year low from 2017. A clear break below 1.0300 now sets up the next downside extension towards parity. At the same time, technical studies have been in the process of unwinding from oversold. But back above 1.1000 would be required at a minimum to take the immediate pressure off the downside.EURUSD – fundamental overview
The Euro came under pressure into the end of last week on the back of an awful Eurozone retail sales print which came in at -1.3% versus the 0.1% expected. Meanwhile, Euro area composite PMIs will also all revised lower. On the other side, setbacks were somewhat mitigated by rising bund yields and an expectation of more tightening from the ECB by year end. Looking ahead, Monday’s calendar is exceptionally thin, with no first-tier data scheduled on the docket.EURUSD - Technical charts in detail
GBPUSD – technical overview
The market continues to be exceptionally well supported on dips down into the 1.2000 area, with the latest setback once again holding up ahead of the barrier. Overall, the daily trend remains bearish, though there are signs of the market wanting to put in a meaningful bottom ahead of the next major upside extension. Look for a clear break back above 1.3000 to strengthen this outlook.GBPUSD – fundamental overview
UK markets were closed at the end of last week for the Queen's Jubilee, which resulted in thinner trade. We did see relative underperformance in the Pound, with yield differentials moving in the Euro's favor on the shifting expectations for ECB policy. Looking ahead, Monday’s calendar is exceptionally thin, with no first-tier data scheduled on the docket.USDJPY – technical overview
The market has rocketed higher to its highest levels since 2002 after breaking through the 2015 high. Technical studies are however looking stretched, with scope for a sizable consolidation and correction in the weeks ahead. Look for additional upside from here to be limited to the 132.00 area for now. A break back below 126.00 would confirm the likelihood of a deeper pullback.USDJPY – fundamental overview
Policy divergence is playing back into the picture over the past week or so, with market participants once again focusing on yield differentials that continue to weigh heavily in the US Dollar's favor. The BOJ is clearly still more worried about deflation than inflation. Looking ahead, Monday’s calendar is exceptionally thin, with no first-tier data scheduled on the docket.AUDUSD – technical overview
The market has been in recovery mode since bottoming out off the yearly low. Overall however, conditions remain quite choppy, and while the short-term pressure has been taken off the downside, rallies towards 0.7500 should be very well offered.AUDUSD – fundamental overview
There have been some concerns about the Australian housing market as cracks begin to show at the surface. April home loans value came in at -6.4% from 2.1% previous. Looking ahead, Monday’s calendar is exceptionally thin, with no first-tier data scheduled on the docket.USDCAD – technical overview
A recent surge back above 1.3000 signals an end to a period of bearish consolidation and suggests the market is in the process of carving out a more significant longer-term base. Next key resistance now comes in up into the 1.3500 area. Setbacks should be very well supported down into the 1.2500 area.USDCAD – fundamental overview
The Canadian Dollar has been pressing higher in the aftermath of last week's 50 basis point rate hike from the Bank of Canada. More hawkish talk out from BoC officials post decision has been helping to fuel the additional gains. Looking ahead, Monday’s calendar is exceptionally thin, with no first-tier data scheduled on the docket.NZDUSD – technical overview
The market has been in recovery mode since bottoming out off the yearly low. Overall however, conditions remain quite choppy, and while the short-term pressure has been taken off the downside, rallies should be very well offered.NZDUSD – fundamental overview
Broad based risk off flow has resulted in renewed downside pressure in the New Zealand Dollar. Looking ahead, Monday’s calendar is exceptionally thin, with no first-tier data scheduled on the docket.US SPX 500 – technical overview
Longer-term technical studies are in the process of unwinding from extended readings off record highs. Look for rallies to be well capped in favor of lower tops and lower lows. Back above 4,312 will be required at a minimum to take the immediate pressure off the downside. Next major support comes in around 3,400.US SPX 500 – fundamental overview
With so little room for additional central bank accommodation, given an already depressed interest rate environment, the prospect for sustainable runs to the topside on easy money policy incentives and government stimulus, should no longer be as enticing to investors. Meanwhile, ongoing worry associated with coronavirus fallout, rising inflation, and geopolitical tension should continue to weigh more heavily on investor sentiment in 2022.GOLD (SPOT) – technical overview
The 2019 breakout above the 2016 high at 1375 was a significant development, opening the door for fresh record highs. Setbacks should now be well supported above 1700.GOLD (SPOT) – fundamental overview
The yellow metal continues to be well supported on dips with solid demand from medium and longer-term accounts. These players are more concerned about exhausted monetary policy, extended global equities, coronavirus fallout, inflation risk, and geopolitical tension. All of this should keep the commodity well supported, with many market participants also fleeing to the hard asset as the grand dichotomy of record high equities and record low yields comes to an unnerving climax.