


Today’s report: Trading conditions to thin out for US long holiday weekend
We’ve just closed out the first half of 2022 and it wasn’t pretty. The S&P 500 is down 20% year to date, the NASDAQ down 30% year to date, currencies have been hit hard against the US dollar, and bitcoin has been slammed, down 60% year to date.
Wake-up call
- discouraging data
- UK GDP
- Japanese Tankan
- USD selling
- Oil slide
- macro themes
- Stocks vulnerable
- Dealers report
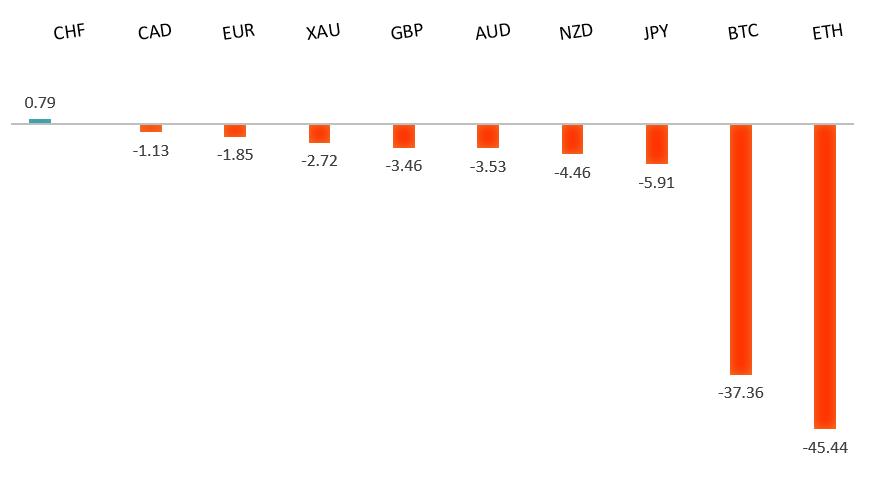
Peformance chart: 30 Day Performance vs. US dollar (%)
Suggested reading
- Markets Are Signaling a Pyrrhic Inflation Victory, J. Authers, Bloomberg (June 30, 2022)
- Michael Burry Seeing Growth In Growth & Disinflation, L. Lango, Investor Place (June 29, 2022)
Chart talk: Technical & fundamental highlights
Choose pair:
EURUSD – technical overview
The market has come under intense pressure in recent weeks, with setbacks accelerating to retest the multi-year low from 2017. A clear break below 1.0300 now sets up the next downside extension towards parity. At the same time, technical studies have been in the process of unwinding from oversold. But back above 1.1000 would be required at a minimum to take the immediate pressure off the downside.EURUSD – fundamental overview
There wasn't much of any good news out of the Eurozone on Thursday, though the Euro was able to shrug off discouraging German unemployment numbers and rally on the back of broad US Dollar weakness. The US Dollar was sold into the monthly close as PCE reads came in softer. Key standouts on Friday’s calendar come from Eurozone inflation, US ISM manufacturing, and US construction spending.EURUSD - Technical charts in detail
GBPUSD – technical overview
The market continues to be exceptionally well supported on dips down into the 1.2000 area, with the latest setback once again holding up around the barrier. Overall, the daily trend remains bearish, though there are signs of the market wanting to put in a meaningful bottom ahead of the next major upside extension. Look for a clear break back above 1.2700 to strengthen this outlook. A monthly close below 1.2000 would force a rethink of the outlook.GBPUSD – fundamental overview
Thursday's UK GDP read came in as expected, which prevented the Pound from extending declines, before the currency managed to put in a recovery on broad based US Dollar selling, largely attributed to the softer US PCE read. Key standouts on Friday’s calendar come from Eurozone inflation, US ISM manufacturing, and US construction spending.USDJPY – technical overview
The market has rocketed higher to its highest levels since 1998 after breaking through the 2002 high. Technical studies are however looking stretched, with scope for a sizable consolidation and correction in the weeks ahead. Look for additional upside from here to be well capped ahead of 140.00. A break back below 130.00 would take the immediate pressure off the topside.USDJPY – fundamental overview
Finally some demand for a very beaten down Yen on Thursday. Most of the demand came from broad based US Dollar selling. It was interesting to see the Yen so well bid on the day despite some big Japanese economic data misses highlighted by industrial production and housing starts. Key standouts on Friday’s calendar come from Tokyo CPI, the Japanese Tankan report, Eurozone inflation, US ISM manufacturing, and US construction spending.AUDUSD – technical overview
Overall pressure remains on the downside and conditions remain quite choppy. A break back above 0.7900 would be required to force a shift in the structure and suggest we are seeing a more significant bullish reversal. Until then, scope exists for a retest and break of the yearly low.AUDUSD – fundamental overview
The Australian Dollar put in a mild recovery on Thursday, with the currency getting a boost from a rebound in sentiment and broad based US Dollar outflows. Key standouts on Friday’s calendar come from Eurozone inflation, US ISM manufacturing, and US construction spending.USDCAD – technical overview
A recent surge back above 1.3000 signals an end to a period of bearish consolidation and suggests the market is in the process of carving out a more significant longer-term base. Next key resistance now comes in up into the 1.3500 area. Setbacks should be very well supported down into the 1.2500 area.USDCAD – fundamental overview
The Canadian Dollar was higher on Thursday, though not much, with a pullback in the price of OIL offsetting a lot of the demand from risk on and broad based US Dollar outflows. Canada GDP came in as expected and didn't factor into price action. Key standouts on Friday’s calendar come from Eurozone inflation, US ISM manufacturing, and US construction spending.NZDUSD – technical overview
Overall pressure remains on the downside and conditions remain quite choppy. A break back above 0.6600 would be required to force a shift in the structure and suggest we are seeing a more significant bullish reversal. Until then, scope exists for fresh yearly lows and a retest of the 2015 low down towards 0.6100.NZDUSD – fundamental overview
The New Zealand Dollar put in a mild recovery on Thursday, with the currency getting a boost from a rebound in sentiment and broad based US Dollar outflows. Key standouts on Friday’s calendar come from Eurozone inflation, US ISM manufacturing, and US construction spending.US SPX 500 – technical overview
Longer-term technical studies are in the process of unwinding from extended readings off record highs. Look for rallies to be well capped in favor of lower tops and lower lows. Back above 4,206 will be required at a minimum to take the immediate pressure off the downside. Next major support comes in around 3,400.US SPX 500 – fundamental overview
With so little room for additional central bank accommodation, given an already depressed interest rate environment, the prospect for sustainable runs to the topside on easy money policy incentives and government stimulus, should no longer be as enticing to investors. Meanwhile, ongoing worry associated with rising inflation and slower growth should continue to weigh more heavily on investor sentiment in 2022.GOLD (SPOT) – technical overview
The 2019 breakout above the 2016 high at 1375 was a significant development, opening the door for fresh record highs. Setbacks should now be well supported above 1700.GOLD (SPOT) – fundamental overview
The yellow metal continues to be well supported on dips with solid demand from medium and longer-term accounts. These players are more concerned about exhausted monetary policy, extended global equities, and inflation risk. All of this should keep the commodity well supported, with many market participants also fleeing to the hard asset as the grand dichotomy of record high equities and record low yields comes to an unnerving climax.