


Special report: FOMC decision preview
Today’s report: Plenty of tension into Fed day
Things are a little shaky into what should be a nervous day of trade on this Wednesday. As things stand, we come into Fed day with stocks turning back down and the US Dollar regaining some bids. It seems Tuesday’s run of discouraging US economic data is definitely playing a part.
Wake-up call
- Energy crisis
- moving up
- new members
- Aussie CPI
- Oil falters
- global sentiment
- Stocks vulnerable
- Dealers report
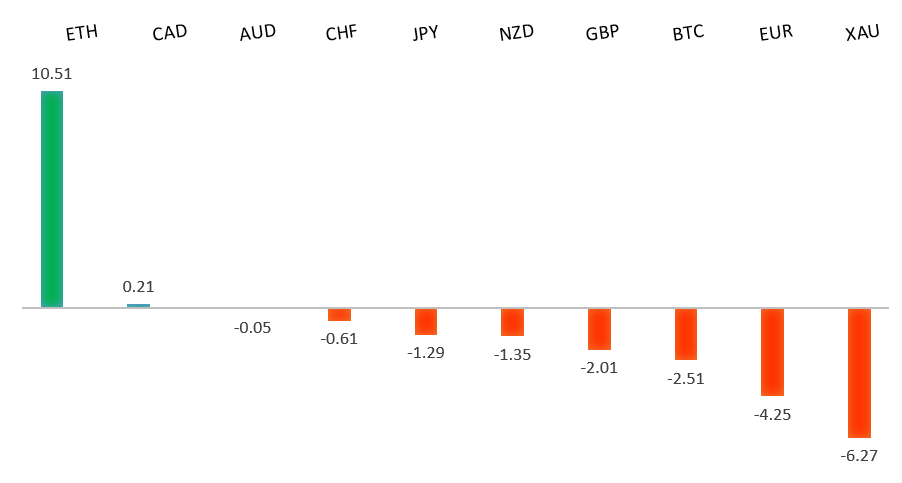
Peformance chart: 30 Day Performance vs. US dollar (%)
Suggested reading
- Putin Is Playing Hunger Games in the Black Sea, C. Marques, Bloomberg (July 26, 2022)
- Tackling A Growing Methane Problem, D. Brower, Financial Times (July 24, 2022)
Chart talk: Technical & fundamental highlights
Choose pair:
EURUSD – technical overview
The market has come under intense pressure in recent months, with setbacks accelerating below the critical multi-year low from 2017 at 1.0340. This sets up a test of monumental support in the form of parity. At the same time, technical studies are tracking in oversold territory, suggesting additional setbacks should be limited. Back above 1.0500 would be required to take the immediate pressure off the downside.EURUSD – fundamental overview
We have seen renewed downside pressure on the Euro as energy fears continue to grip the market. Gazprom has just come out announcing a drastic cut to gas deliveries through its main pipeline to Europe from tomorrow. EU leaders have responded by reaching an agreement to cut gas usage by 15% through next winter on the prospect of a full cut-off from Russian supplies. Key standouts on Wednesday’s calendar come from US durable goods, trade, pending home sales, and the FOMC decision late in the day.EURUSD - Technical charts in detail
GBPUSD – technical overview
The market continues to be exceptionally well supported on dips below 1.2000. Unless we see a monthly close below 1.2000, we expect this to continue to be the case. Look for a break back above 1.2200 to take the immediate pressure off the downside.GBPUSD – fundamental overview
The Pound has put in an impressive recovery in recent sessions, this despite softer UK economic data. The latest UK CBI survey revealed that industrial output growth was the weakest since April 2021. But there was some good news in the fall in the price balance to its lowest level since September. Front runner for Conservative leader and new UK PM Foreign Secretary Truss vows she would introduce low-tax, light-regulation investment zones across the UK to spur economic growth. Key standouts on Wednesday’s calendar come from US durable goods, trade, pending home sales, and the FOMC decision late in the day.USDJPY – technical overview
The market has rocketed higher to its highest levels since 1998 after breaking through the 2002 high. Technical studies are however looking stretched, with scope for a sizable consolidation and correction in the weeks ahead. Look for additional upside from here to be well capped ahead of 140.00. A break back below 134.00 would take the immediate pressure off the topside.USDJPY – fundamental overview
We've seen some demand for the Yen in recent sessions. Most of this price action comes from position adjusting from shorter-term accounts in the aftermath of a massive decline in the Yen. There has also been a round of position adjusting in favor of the Yen as the market prices in a less aggressive Fed path, and as the market takes in the arrival of two slightly more hawkish leaning members to the BOJ. Key standouts on Wednesday’s calendar come from US durable goods, trade, pending home sales, and the FOMC decision late in the day.AUDUSD – technical overview
Overall pressure remains on the downside and conditions remain quite choppy. A break back above 0.7070 would be required at a minimum to take the immediate pressure off the downside. Until then, scope exists for deeper setbacks towards 0.6500.AUDUSD – fundamental overview
Australia's Q2 CPI report is out early Wednesday, and this could determine whether the RBA delivers a 50bps rate hike on August 2nd that is currently priced or a jumbo 75bps move. Other key standouts on Wednesday’s calendar come from US durable goods, trade, pending home sales, and the FOMC decision late in the day.USDCAD – technical overview
A recent surge back above 1.3000 signals an end to a period of bearish consolidation and suggests the market is in the process of carving out a more significant longer-term base. Next key resistance now comes in up into the 1.3500 area. Setbacks should be very well supported down into the 1.2500 area.USDCAD – fundamental overview
A pullback in the price of oil and lower stocks were behind this latest wave of selling in the Canadian Dollar. Key standouts on Wednesday’s calendar come from US durable goods, trade, pending home sales, and the FOMC decision late in the day.NZDUSD – technical overview
Overall pressure remains on the downside and conditions remain quite choppy. A break back above 0.6400 would be required to force a shift in the structure and suggest we are seeing a more significant bullish reversal. Until then, scope exists for fresh yearly lows and a retest of the major psychological barrier at 0.6000.NZDUSD – fundamental overview
The New Zealand Dollar recovery has topped out for now, with the currency coming back under pressure as risk comes off and US equities head south. Key standouts on Wednesday’s calendar come from US durable goods, trade, pending home sales, and the FOMC decision late in the day.US SPX 500 – technical overview
Longer-term technical studies are in the process of unwinding from extended readings off record highs. Look for rallies to be well capped in favor of lower tops and lower lows. Back above 4,206 will be required at a minimum to take the immediate pressure off the downside. Next major support comes in around 3,400.US SPX 500 – fundamental overview
We've finally reached a point in the cycle where the Fed recognizes unanchored inflation expectations pose a greater downside risk than over-tightening. This is significant, as it means less investor friendly monetary policy that risks potential recession in the months ahead. And so, naturally, stocks have been under intense pressure in 2022.GOLD (SPOT) – technical overview
The 2019 breakout above the 2016 high at 1375 was a significant development, opening the door for fresh record highs. Setbacks should now be well supported above 1700 on a monthly close basis.GOLD (SPOT) – fundamental overview
The yellow metal continues to be well supported on dips with solid demand from medium and longer-term accounts. These players are more concerned about inflation risk and a less upbeat global growth outlook. All of this should keep the commodity well supported, with many market participants also fleeing to the hard asset as the grand dichotomy of record high equities and record low yields comes to an unnerving climax.