


Next 24 hours: FOMC reflections
Today’s report: Investors respond positively to Fed decision
The Fed decision has come and gone and went off pretty much as expected. The Fed went ahead and raised rates by 75 basis points, while the Fed Chair offered up some optimism after saying he didn’t believe the US economy was in recession.
Wake-up call
- bad news
- Inflation indicators
- FOMC decision
- softer CPI
- USD outflows
- global sentiment
- Stocks vulnerable
- Dealers report
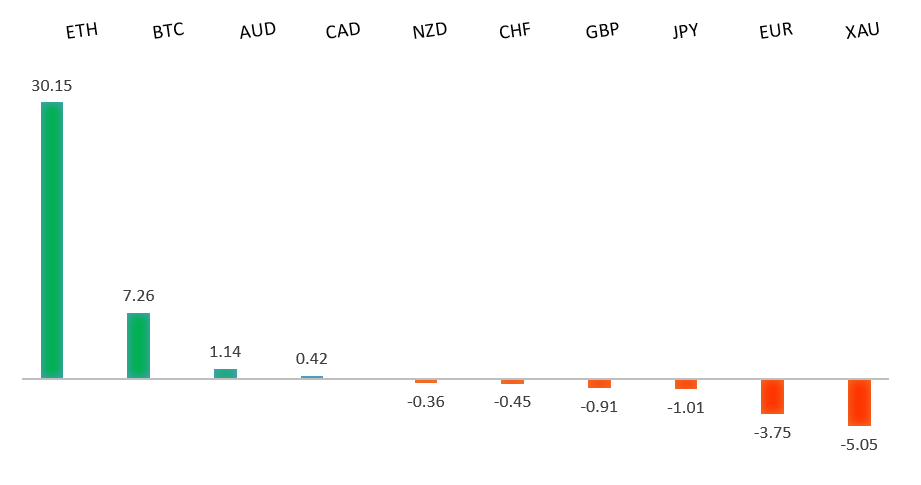
Peformance chart: 30 Day Performance vs. US dollar (%)
Suggested reading
- OPEC+ Walks a Fine Line on Oil Output, J. Lee, Bloomberg (July 27, 2022)
- How It All Turned Sour for Tiger Global, L. Fletcher, Financial Times (July 26, 2022)
Chart talk: Technical & fundamental highlights
Choose pair:
EURUSD – technical overview
The market has come under intense pressure in recent months, with setbacks accelerating below the critical multi-year low from 2017 at 1.0340. This sets up a test of monumental support in the form of parity. At the same time, technical studies are tracking in oversold territory, suggesting additional setbacks should be limited. Back above 1.0500 would be required to take the immediate pressure off the downside.EURUSD – fundamental overview
The Euro had been struggling on bad news early Wednesday, before recovery nicely on account of an as expected Fed rate hike and less hawkish communication. Ahead of the Fed decision, the Euro was sold on German GfK consumer confidence sinking to a record low, and JP Morgan downgrading Eurozone economic forecasts. On the positive side, the Kremlin announced Gazprom would be able to pump more once the turbines were fixed. Key standouts on Thursday’s calendar come from Aussie retail sales, Eurozone sentiment and confidence reads, German inflation, US GDP, and initial jobless claims.EURUSD - Technical charts in detail
GBPUSD – technical overview
The market continues to be exceptionally well supported on dips below 1.2000. Unless we see a monthly close below 1.2000, we expect this to continue to be the case. Look for a break back above 1.2200 to take the immediate pressure off the downside.GBPUSD – fundamental overview
In the UK, the BRC reported their measure of inflation increased to 4.4% in July vs 3.1% last, the fastest rate since at least 2005, stretching consumers' spending power even further. This also helped to push up rate hike expectations at the BOE. Meanwhile, there was broad based selling of the US Dollar in the aftermath of an as expected Fed policy decision. Key standouts on Thursday’s calendar come from Aussie retail sales, Eurozone sentiment and confidence reads, German inflation, US GDP, and initial jobless claims.USDJPY – technical overview
The market has rocketed higher to its highest levels since 1998 after breaking through the 2002 high. Technical studies are however looking stretched, with scope for a sizable consolidation and correction in the weeks ahead. Look for additional upside from here to be well capped ahead of 140.00. A break back below 134.00 would take the immediate pressure off the topside.USDJPY – fundamental overview
We've seen some demand for the Yen in recent sessions. Most of this price action comes from position adjusting from shorter-term accounts following a massive decline in the Yen. There has also been a round of position adjusting in favor of the Yen as the market sells US Dollars in the aftermath of an as expected Fed decision. Key standouts on Thursday’s calendar come from Aussie retail sales, Eurozone sentiment and confidence reads, German inflation, US GDP, and initial jobless claims.AUDUSD – technical overview
Overall pressure remains on the downside and conditions remain quite choppy. A break back above 0.7070 would be required at a minimum to take the immediate pressure off the downside. Until then, scope exists for deeper setbacks towards 0.6500.AUDUSD – fundamental overview
Wednesday's softer inflation data out of Australia may have taken some of the wind out of the sails of RBA hawks. At the same time, any Aussie selling was more than offset by a wave of US Dollar outflows in the aftermath of an as expected Fed decision. Key standouts on Thursday’s calendar come from Aussie retail sales, Eurozone sentiment and confidence reads, German inflation, US GDP, and initial jobless claims.USDCAD – technical overview
A recent surge back above 1.3000 signals an end to a period of bearish consolidation and suggests the market is in the process of carving out a more significant longer-term base. Next key resistance now comes in up into the 1.3500 area. Setbacks should be very well supported down into the 1.2500 area.USDCAD – fundamental overview
Massive US Dollar outflows post Fed decision have resulted in demand for the Canadian Dollar. Stocks higher and oil higher have also contributed to the Loonie upside. Key standouts on Thursday’s calendar come from Aussie retail sales, Eurozone sentiment and confidence reads, German inflation, US GDP, and initial jobless claims.NZDUSD – technical overview
Overall pressure remains on the downside and conditions remain quite choppy. A break back above 0.6400 would be required to force a shift in the structure and suggest we are seeing a more significant bullish reversal. Until then, scope exists for fresh yearly lows and a retest of the major psychological barrier at 0.6000.NZDUSD – fundamental overview
The New Zealand Dollar has been better bid of late, getting help from US Dollar outflows and a US equities recovery post FOMC decision. Key standouts on Thursday’s calendar come from Aussie retail sales, Eurozone sentiment and confidence reads, German inflation, US GDP, and initial jobless claims.US SPX 500 – technical overview
Longer-term technical studies are in the process of unwinding from extended readings off record highs. Look for rallies to be well capped in favor of lower tops and lower lows. Back above 4,206 will be required at a minimum to take the immediate pressure off the downside. Next major support comes in around 3,400.US SPX 500 – fundamental overview
We've finally reached a point in the cycle where the Fed recognizes unanchored inflation expectations pose a greater downside risk than over-tightening. This is significant, as it means less investor friendly monetary policy that risks potential recession in the months ahead. And so, naturally, stocks have been under intense pressure in 2022.GOLD (SPOT) – technical overview
The 2019 breakout above the 2016 high at 1375 was a significant development, opening the door for fresh record highs. Setbacks should now be well supported above 1700 on a monthly close basis.GOLD (SPOT) – fundamental overview
The yellow metal continues to be well supported on dips with solid demand from medium and longer-term accounts. These players are more concerned about inflation risk and a less upbeat global growth outlook. All of this should keep the commodity well supported, with many market participants also fleeing to the hard asset as the grand dichotomy of record high equities and record low yields comes to an unnerving climax.