


Next 24 hours: A welcome bout of consolidation
Today’s report: Blood in the streets
The market continues to lean back to the side of considering a higher rate trajectory from the Federal Reserve, and will be looking for more messages to this tune out of Jackson Hole later this week.
Wake-up call
- Bundesbank warnings
- tough spot
- Fed pivot
- China efforts
- Discouraging data
- Toxic mix
- Inflation headache
- Dealers report
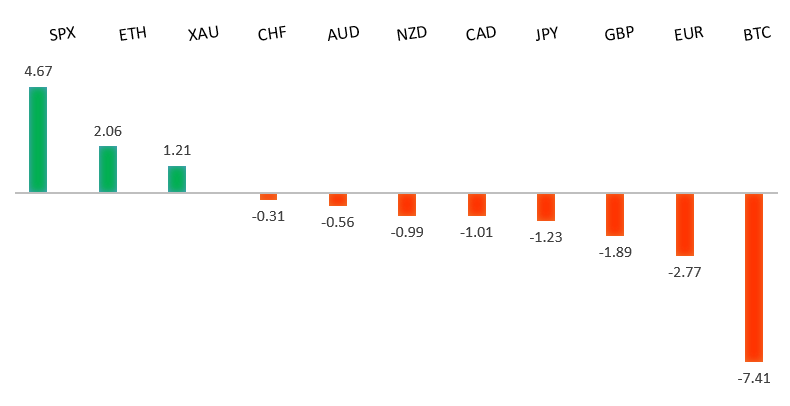
Peformance chart: 30 Day Performance vs. US dollar (%)
Suggested reading
- Hedge Funds Pile Into a Record Hawkish Rate Bet, E. Bolingbroke, Bloomberg (August 22, 2022)
- No, This Is Not 1970s Style Stagflation, J. Caton, AIER (August 19, 2022)
Chart talk: Technical & fundamental highlights
Choose pair:
EURUSD – technical overview
The market has come under intense pressure in recent months, with setbacks accelerating below the critical multi-year low from 2017 at 1.0340. This has set up a dip below monumental support in the form of parity. At the same time, technical studies are tracking in oversold territory, suggesting additional setbacks should be limited. Back above 1.0500 would be required to take the immediate pressure off the downside.EURUSD – fundamental overview
European energy problems have worsened, adding to downside pressure on the Euro below parity. Meanwhile, the Bundesbank has warned of economic contraction. Key standouts on Tuesday’s calendar come from manufacturing PMI reads out of Germany, the Eurozone, UK, and US, UK CBI industrial trends, and US new home sales.EURUSD - Technical charts in detail
GBPUSD – technical overview
The market continues to be exceptionally well supported on dips below 1.2000. Unless we see a monthly close below 1.2000, we expect this to continue to be the case. Look for a push back above 1.2300 to strengthen the case for the establishment of a meaningful base.GBPUSD – fundamental overview
The Pound hasn't been immune to all of the weakness in the currency markets, sinking to fresh yearly lows against the Buck. The market is worried about the BOE being backed into a corner on rates, all while dealing with rocketing inflation, higher energy bills, fading prospects for a government tax cut, and a strike at the largest UK port. Key standouts on Tuesday’s calendar come from manufacturing PMI reads out of Germany, the Eurozone, UK, and US, UK CBI industrial trends, and US new home sales.USDJPY – technical overview
Technical studies are in the process of unwinding, with scope for correction in the days and weeks ahead. Look for additional upside from here to be well capped. Next key support comes in at 130.00.USDJPY – fundamental overview
The Yen has come under more pressure of late, this on the back of an unwinding of dovish leaning Fed bets. The market was looking for the Fed to cut rates in 2023, but all of the hawkish talk has been pricing these odds off the table. The Yen is also getting hit amidst the fallout in currencies like the RMB and KRW. Key standouts on Tuesday’s calendar come from manufacturing PMI reads out of Germany, the Eurozone, UK, and US, UK CBI industrial trends, and US new home sales.AUDUSD – technical overview
Overall pressure remains on the downside despite the recent recovery and conditions remain quite choppy. A break back above 0.7137 would be required to take the pressure off the downside. Until then, scope exists for a lower top below 0.7284 and deeper setbacks towards 0.6500.AUDUSD – fundamental overview
The Australian Dollar has been contending with a potential RMB break, with the market considering the possibility of a China currency devaluation. The move lower in US equities and downside pressure on commodities prices has also been weighing on the Australian Dollar. And yet, Aussie has held up better than most currencies, presumably on the back of the latest attempts out of China to ease rates further. Key standouts on Tuesday’s calendar come from manufacturing PMI reads out of Germany, the Eurozone, UK, and US, UK CBI industrial trends, and US new home sales.USDCAD – technical overview
A recent surge back above 1.3000 signals an end to a period of bearish consolidation and suggests the market is in the process of carving out a more significant longer-term base. Next key resistance now comes in up into the 1.3500 area. Setbacks should be very well supported down into the 1.2500 area.USDCAD – fundamental overview
The Canadian Dollar has been sold of late, with economic data coming in on the softer side out of Canada, all while the market is reconsidering dovish leaning Fed bets, in light of all the hawkish Fed speak. Last Friday, Canada retail sales disappointed, falling for the first time in seven months. Key standouts on Tuesday’s calendar come from manufacturing PMI reads out of Germany, the Eurozone, UK, and US, UK CBI industrial trends, and US new home sales.NZDUSD – technical overview
Overall pressure remains on the downside despite the recent recovery and conditions remain quite choppy. A break back above 0.6469 would be required to take the pressure off the downside. Until then, scope exists for a lower top below 0.6577 and deeper setbacks below 0.6000.NZDUSD – fundamental overview
The New Zealand Dollar has been getting hit hard of late. The combination of a hawkish RBNZ, rapidly weakening local housing market, and weakness in the APAC region has been a toxic mix for the New Zealand economy and outlook for the New Zealand Dollar. Key standouts on Tuesday’s calendar come from manufacturing PMI reads out of Germany, the Eurozone, UK, and US, UK CBI industrial trends, and US new home sales.US SPX 500 – technical overview
Longer-term technical studies are in the process of unwinding from extended readings off record highs. Look for rallies to be well capped in favor of lower tops and lower lows. Back above 4,500 will be required at a minimum to take the immediate pressure off the downside. Next major support comes in around 3,400.US SPX 500 – fundamental overview
We've finally reached a point in the cycle where the Fed recognizes unanchored inflation expectations pose a greater downside risk than over-tightening. This is significant, as it means less investor friendly monetary policy that risks potential recession in the months ahead. We have seen an attempt at recovery in recent weeks, with softer CPI reads helping. But overall, we expect inflation to continue to be a problem that results in renewed downside pressure into rallies.GOLD (SPOT) – technical overview
The 2019 breakout above the 2016 high at 1375 was a significant development, opening the door for fresh record highs. Setbacks should now be well supported above 1700 on a monthly close basis.GOLD (SPOT) – fundamental overview
The yellow metal continues to be well supported on dips with solid demand from medium and longer-term accounts. These players are more concerned about inflation risk and a less upbeat global growth outlook. All of this should keep the commodity well supported, with many market participants also fleeing to the hard asset as the grand dichotomy of record high equities and record low yields comes to an unnerving climax.