


Next 24 hours: China efforts help to bolster sentiment
Today’s report: Expect more volatility into the end of the week
Things are likely to heat up into this latter half of the week, this after an anemic calendar thus far and ahead of key risk Thursday and Friday in the form of the Jackson Hole Symposium and a Fed Powell communication respectively.
Wake-up call
- ECB Minutes
- Stagflation worry
- surging inflation
- China economy
- higher oil
- broader market
- Inflation headache
- Dealers report
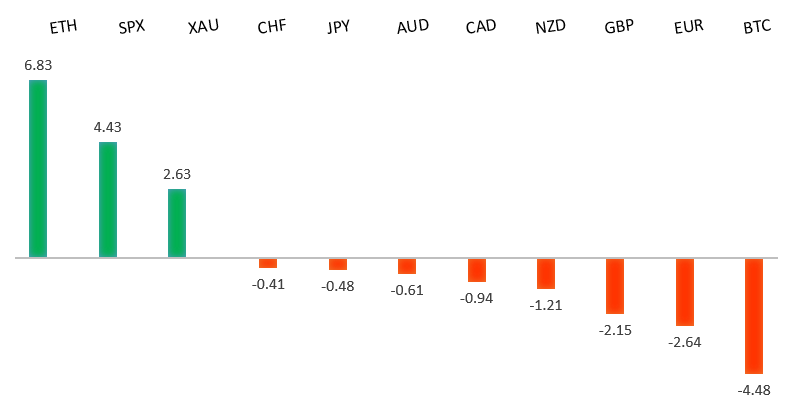
Peformance chart: 30 Day Performance vs. US dollar (%)
Suggested reading
- Markets Primed for All-or-Nothing Sweepstakes on Powell, L. Wang, Bloomberg (August 24, 2022)
- The Silk Belt And Road To Nowhere, G. Fahrion, Spiegel (August 24, 2022)
Chart talk: Technical & fundamental highlights
Choose pair:
EURUSD – technical overview
The market has come under intense pressure in recent months, with setbacks accelerating below the critical multi-year low from 2017 at 1.0340. This has set up a dip below monumental support in the form of parity. At the same time, technical studies are tracking in oversold territory, suggesting additional setbacks should be limited. Back above 1.0500 would be required to take the immediate pressure off the downside.EURUSD – fundamental overview
Absence of economic data on Wednesday left the Euro in consolidation mode, with traders comfortable to position into Thursday and Friday event risk. Key standouts on Thursday’s calendar come from German GDP, German Ifo reads, the ECB Minutes, US GDP, US initial jobless claims, and the Jackson Hole Symposium.EURUSD - Technical charts in detail
GBPUSD – technical overview
The market continues to be exceptionally well supported on dips below 1.2000. Unless we see a monthly close below 1.2000, we expect this to continue to be the case. Look for a push back above 1.2300 to strengthen the case for the establishment of a meaningful base.GBPUSD – fundamental overview
The UK rates market has been increasing bets on a more hawkish leaning BOE. At the same time, the UK money market has also priced a peak base rate of 4.5% in May 2023. The Pound has been suffering from stagflation risk of late, though historically speaking, the currency doesn't like trading below 1.2000 for any meaningful period of time. Key standouts on Thursday’s calendar come from German GDP, German Ifo reads, the ECB Minutes, US GDP, US initial jobless claims, and the Jackson Hole Symposium.USDJPY – technical overview
Technical studies are in the process of unwinding, with scope for correction in the days and weeks ahead. Look for additional upside from here to be well capped. Next key support comes in at 130.00.USDJPY – fundamental overview
As much as the Yen has been sold of late, the currency has at least managed to stabilize a bit in recent sessions. It seems rocketing inflation in Japan has been difficult for even the BOJ to ignore, something that could at least force policy that is somewhat less accommodative than what we've come to see from the central bank. Key standouts on Thursday’s calendar come from German GDP, German Ifo reads, the ECB Minutes, US GDP, US initial jobless claims, and the Jackson Hole Symposium.AUDUSD – technical overview
Overall pressure remains on the downside despite the recent recovery and conditions remain quite choppy. A break back above 0.7137 would be required to take the pressure off the downside. Until then, scope exists for a lower top below 0.7284 and deeper setbacks towards 0.6500.AUDUSD – fundamental overview
The Australian Dollar was a little lower on Wednesday on account of growing concerns about the China economy. Key standouts on Thursday’s calendar come from German GDP, German Ifo reads, the ECB Minutes, US GDP, US initial jobless claims, and the Jackson Hole Symposium.USDCAD – technical overview
A recent surge back above 1.3000 signals an end to a period of bearish consolidation and suggests the market is in the process of carving out a more significant longer-term base. Next key resistance now comes in up into the 1.3500 area. Setbacks should be very well supported down into the 1.2500 area.USDCAD – fundamental overview
Canada wholesale sales were off on Wednesday, but this was offset by the run higher in the price of oil. Key standouts on Thursday’s calendar come from German GDP, German Ifo reads, the ECB Minutes, US GDP, US initial jobless claims, and the Jackson Hole Symposium.NZDUSD – technical overview
Overall pressure remains on the downside despite the recent recovery and conditions remain quite choppy. A break back above 0.6469 would be required to take the pressure off the downside. Until then, scope exists for a lower top below 0.6577 and deeper setbacks below 0.6000.NZDUSD – fundamental overview
The New Zealand Dollar didn't do much at all in a quiet Wednesday trading day overall. The currency has been weighed down of late on risk off flow and stagflation fears in the New Zealand economy. Key standouts on Thursday’s calendar come from German GDP, German Ifo reads, the ECB Minutes, US GDP, US initial jobless claims, and the Jackson Hole Symposium.US SPX 500 – technical overview
Longer-term technical studies are in the process of unwinding from extended readings off record highs. Look for rallies to be well capped in favor of lower tops and lower lows. Back above 4,500 will be required at a minimum to take the immediate pressure off the downside. Next major support comes in around 3,400.US SPX 500 – fundamental overview
We've finally reached a point in the cycle where the Fed recognizes unanchored inflation expectations pose a greater downside risk than over-tightening. This is significant, as it means less investor friendly monetary policy that risks potential recession in the months ahead. We have seen an attempt at recovery in recent weeks, with softer CPI reads helping. But overall, we expect inflation to continue to be a problem that results in renewed downside pressure into rallies.GOLD (SPOT) – technical overview
The 2019 breakout above the 2016 high at 1375 was a significant development, opening the door for fresh record highs. Setbacks should now be well supported above 1700 on a monthly close basis.GOLD (SPOT) – fundamental overview
The yellow metal continues to be well supported on dips with solid demand from medium and longer-term accounts. These players are more concerned about inflation risk and a less upbeat global growth outlook. All of this should keep the commodity well supported, with many market participants also fleeing to the hard asset as the grand dichotomy of record high equities and record low yields comes to an unnerving climax.