


Next 24 hours: Another round of inflation data
Today’s report: Harsh realities that can't be ignored
The market was reminded just how fragile the recent rally in risk assets actually was, and also reminded just how significant inflation data is in 2022. All of the optimism that we had seen build up in recent sessions was eviscerated on the revelation of a still hot run of inflation data out of the US.
Wake-up call
- awful ZEW
- hike odds
- policy divergence
- confidence reads
- commodity complex
- Risk liquidation
- Inflation headache
- Dealers report
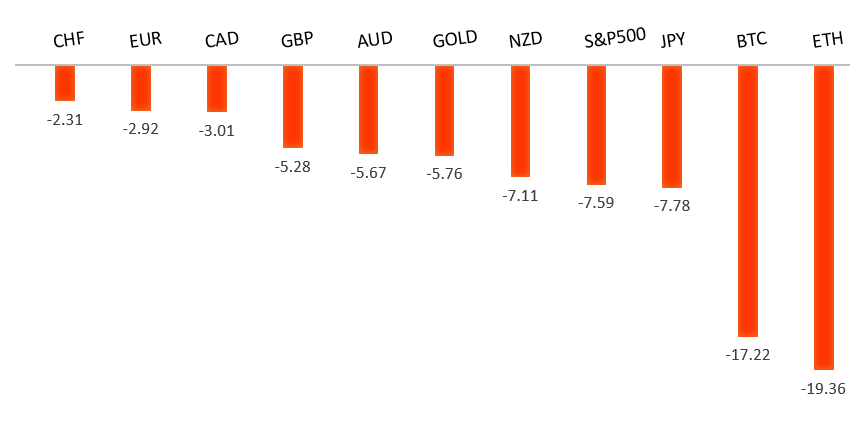
Peformance chart: 30 Day Performance vs. US dollar (%)
Suggested reading
- Air Travel Has Almost Recovered. Airlines? Not So Much, D. Fickling, Bloomberg (September 15, 2022)
- How Putin Held Europe Hostage Over Energy, J. Sandy, Financial Times (September 8, 2022)
Chart talk: Technical & fundamental highlights
Choose pair:
EURUSD – technical overview
The market has come under intense pressure in recent months, with setbacks accelerating below the critical multi-year low from 2017 at 1.0340. This has set up a dip below monumental support in the form of parity. At the same time, technical studies are tracking in oversold territory, suggesting additional setbacks should be limited. Back above 1.0500 would be required to take the immediate pressure off the downside.EURUSD – fundamental overview
The Euro tried its best to ignore an awful run of ZEW numbers, but finally succumbed to the downside pressure after the market was flooded with a wave of selling pressure on the hotter than expected US CPI read. Key standouts on Wednesday’s calendar come from UK inflation data, Eurozone industrial production, a speech from the European Commission President, and US producer prices.EURUSD - Technical charts in detail
GBPUSD – technical overview
The market continues to be exceptionally well supported on dips below 1.2000. At the same time, there is now risk for a retest of the multi-year low from 2020 down in the 1.1400 area before we see the formation of a base and the next big push back through 1.2000. Back above 1.1761 takes the immediate pressure off the downside.GBPUSD – fundamental overview
Though there were some concerning components in the UK employment data on Tuesday, the net outcome was mostly positive. Odds for a 75 basis point BOE hike later this month have risen as a consequence. However, none of this has been a help to the Pound, which took a massive hit back towards recent multi-month lows after US CPI came in hotter than forecast. Key standouts on Wednesday’s calendar come from UK inflation data, Eurozone industrial production, a speech from the European Commission President, and US producer prices.USDJPY – technical overview
Technical studies are looking quite stretched on the longer-term chart, warning of consolidation and correction in the days and weeks ahead. Look for additional upside from here to be well capped into the 145.00 area. Next key support comes in at 140.25.USDJPY – fundamental overview
The massive monetary policy divergence between the Fed and BOJ was once again cast into the spotlight on Tuesday, this after US CPI came in hotter than expected. This resulted in a Yen collapse back to the recent multi-year low against the Buck. Key standouts on Wednesday’s calendar come from UK inflation data, Eurozone industrial production, a speech from the European Commission President, and US producer prices.AUDUSD – technical overview
Overall pressure remains on the downside despite the recent recovery and conditions remain quite choppy. A break back above 0.7137 would be required to take the pressure off the downside. Until then, scope exists for a lower top below 0.7284 and deeper setbacks towards 0.6500.AUDUSD – fundamental overview
The Australian has not been immune to the latest fallout in currencies against the Buck in the aftermath of a hotter than expected US CPI print. Having said that, it's possible things could have been even worse for the Australian Dollar if not for a solid showing from Westpac consumer confidence and NAB business confidence. Key standouts on Wednesday’s calendar come from UK inflation data, Eurozone industrial production, a speech from the European Commission President, and US producer prices.USDCAD – technical overview
A recent surge back above 1.3000 signals an end to a period of bearish consolidation and suggests the market is in the process of carving out a more significant longer-term base. Next key resistance now comes in up into the 1.3500 area. Setbacks should be very well supported down into the 1.2500 area.USDCAD – fundamental overview
The commodities complex broke down hard on Tuesday, leaving the Canadian Dollar nowhere to go but lower. All of this was triggered by a hotter than expected inflation reading out of the US. Key standouts on Wednesday’s calendar come from UK inflation data, Eurozone industrial production, a speech from the European Commission President, and US producer prices.NZDUSD – technical overview
Overall pressure remains on the downside despite the recent recovery and conditions remain quite choppy. A break back above 0.6251 would be required to take the pressure off the downside. Until then, scope exists for deeper setbacks towards 0.5500.NZDUSD – fundamental overview
The risk correlated New Zealand Dollar has extended its run of multi-month lows, this on the back of the latest downturn in global sentiment in the aftermath of a hotter than expected US CPI print. Key standouts on Wednesday’s calendar come from UK inflation data, Eurozone industrial production, a speech from the European Commission President, and US producer prices.US SPX 500 – technical overview
Longer-term technical studies are in the process of unwinding from extended readings off record highs. Look for rallies to be well capped in favor of lower tops and lower lows. Back above 4,328 will be required at a minimum to take the immediate pressure off the downside. Next major support comes in around 3,400.US SPX 500 – fundamental overview
We've finally reached a point in the cycle where the Fed recognizes unanchored inflation expectations pose a greater downside risk than over-tightening. This is significant, as it means less investor friendly monetary policy that risks potential recession in the months ahead. We have seen an attempt at recovery in recent weeks, with softer CPI reads helping. But overall, we expect inflation to continue to be a problem that results in renewed downside pressure into rallies.GOLD (SPOT) – technical overview
The 2019 breakout above the 2016 high at 1375 was a significant development, opening the door for fresh record highs. Setbacks should now be well supported above 1700 on a monthly close basis.GOLD (SPOT) – fundamental overview
The yellow metal continues to be well supported on dips with solid demand from medium and longer-term accounts. These players are more concerned about inflation risk and a less upbeat global growth outlook. All of this should keep the commodity well supported, with many market participants also fleeing to the hard asset as the grand dichotomy of record high equities and record low yields comes to an unnerving climax.