


Next 24 hours: Heavy batch of US data ahead
Today’s report: Denial and disbelief
The reality of higher for longer rates doesn’t seem to be something the market will be able to get away from in 2022 as much as it tries, and this reality suggests the trend of Dollar strength and equity market weakness could very well continue.
Wake-up call
- weak IP
- tamer inflation
- checking rates
- AUDUSD Aussie employment mostly in line with forecasts
- steady oil
- strong GDP
- Inflation headache
- Dealers report
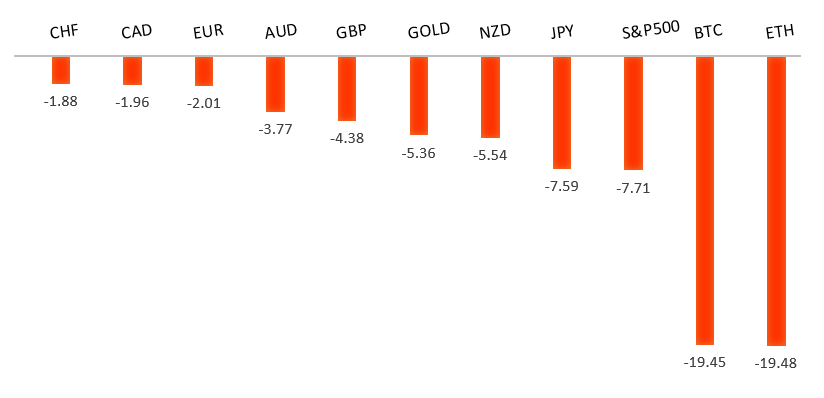
Peformance chart: 30 Day Performance vs. US dollar (%)
Suggested reading
- Inflation’s Terrible, Horrible, No Good, Very Bad Day, J. Authers, Bloomberg (September 15, 2022)
- Do Not Mistake Rising Prices For Inflation, S. Shepard, Real Clear Markets (September 14, 2022)
Chart talk: Technical & fundamental highlights
Choose pair:
EURUSD – technical overview
The market has come under intense pressure in recent months, with setbacks accelerating below the critical multi-year low from 2017 at 1.0340. This has set up a dip below monumental support in the form of parity. At the same time, technical studies are tracking in oversold territory, suggesting additional setbacks should be limited. Back above 1.0500 would be required to take the immediate pressure off the downside.EURUSD – fundamental overview
The Euro rally stalled out on Wednesday after the EU's von der Leyen said the European energy market wasn't functioning anymore. We also got a batch of unimpressive Eurozone industrial production, adding more downside pressure on the single currency. Key standouts on Thursday’s calendar come from German wholesale prices, Eurozone trade and wage growth, Canada housing starts, US retail sales, New York empire manufacturing, the Philly Fed, US initial jobless claims, US industrial production, and US business inventories.EURUSD - Technical charts in detail
GBPUSD – technical overview
The market continues to be exceptionally well supported on dips below 1.2000. At the same time, there is now risk for a retest of the multi-year low from 2020 down in the 1.1400 area before we see the formation of a base and the next big push back through 1.2000. Back above 1.1761 takes the immediate pressure off the downside.GBPUSD – fundamental overview
Wednesday's round of tamer inflation data was seen as a relief to the UK economy, which actually helped to support the Pound. Key standouts on Thursday’s calendar come from German wholesale prices, Eurozone trade and wage growth, Canada housing starts, US retail sales, New York empire manufacturing, the Philly Fed, US initial jobless claims, US industrial production, and US business inventories.USDJPY – technical overview
Technical studies are looking quite stretched on the longer-term chart, warning of consolidation and correction in the days and weeks ahead. Look for additional upside from here to be well capped into the 145.00 area. Next key support comes in at 140.25.USDJPY – fundamental overview
The massive monetary policy divergence between the Fed and BOJ continues to drive the direction in this market, though Wednesday reports of the BOJ checking rates was enough to stop the Yen from additional declines. Key standouts on Thursday’s calendar come from German wholesale prices, Eurozone trade and wage growth, Canada housing starts, US retail sales, New York empire manufacturing, the Philly Fed, US initial jobless claims, US industrial production, and US business inventories.AUDUSD – technical overview
Overall pressure remains on the downside despite the recent recovery and conditions remain quite choppy. A break back above 0.7137 would be required to take the pressure off the downside. Until then, scope exists for a lower top below 0.7284 and deeper setbacks towards 0.6500.AUDUSD – fundamental overview
Aussie employment data came out earlier today and was on the whole in line with expectation. With that said, there hasn't been much reaction to the data, with the currency trading on the bigger picture themes. Key standouts on Thursday’s calendar come from German wholesale prices, Eurozone trade and wage growth, Canada housing starts, US retail sales, New York empire manufacturing, the Philly Fed, US initial jobless claims, US industrial production, and US business inventories.USDCAD – technical overview
A recent surge back above 1.3000 signals an end to a period of bearish consolidation and suggests the market is in the process of carving out a more significant longer-term base. Next key resistance now comes in up into the 1.3500 area. Setbacks should be very well supported down into the 1.2500 area.USDCAD – fundamental overview
The price of oil has held up decently this week, which has perhaps prevented the Canadian Dollar from extending declines more than what we've seen. Ultimately however, with risk off flow playing a central role, there is risk for additional weakness in the Loonie. Key standouts on Thursday’s calendar come from German wholesale prices, Eurozone trade and wage growth, Canada housing starts, US retail sales, New York empire manufacturing, the Philly Fed, US initial jobless claims, US industrial production, and US business inventories.NZDUSD – technical overview
Overall pressure remains on the downside despite the recent recovery and conditions remain quite choppy. A break back above 0.6251 would be required to take the pressure off the downside. Until then, scope exists for deeper setbacks towards 0.5500.NZDUSD – fundamental overview
The risk correlated New Zealand Dollar has extended its run of multi-month lows this week, this on the back of the latest downturn in global sentiment in the aftermath of a hotter than expected US CPI print. Earlier today, New Zealand growth data came in better than expected, though this hasn't done much to bolster the currency. Key standouts on Thursday’s calendar come from German wholesale prices, Eurozone trade and wage growth, Canada housing starts, US retail sales, New York empire manufacturing, the Philly Fed, US initial jobless claims, US industrial production, and US business inventories.US SPX 500 – technical overview
Longer-term technical studies are in the process of unwinding from extended readings off record highs. Look for rallies to be well capped in favor of lower tops and lower lows. Back above 4,328 will be required at a minimum to take the immediate pressure off the downside. Next major support comes in around 3,400.US SPX 500 – fundamental overview
We've finally reached a point in the cycle where the Fed recognizes unanchored inflation expectations pose a greater downside risk than over-tightening. This is significant, as it means less investor friendly monetary policy that risks potential recession in the months ahead. We have seen an attempt at recovery in recent weeks, with softer CPI reads helping. But overall, we expect inflation to continue to be a problem that results in renewed downside pressure into rallies.GOLD (SPOT) – technical overview
The 2019 breakout above the 2016 high at 1375 was a significant development, opening the door for fresh record highs. Setbacks should now be well supported above 1700 on a monthly close basis.GOLD (SPOT) – fundamental overview
The yellow metal continues to be well supported on dips with solid demand from medium and longer-term accounts. These players are more concerned about inflation risk and a less upbeat global growth outlook. All of this should keep the commodity well supported, with many market participants also fleeing to the hard asset as the grand dichotomy of record high equities and record low yields comes to an unnerving climax.