


Next 24 hours: Subdued conditions but also more of the same
Today’s report: Investor friendly policy no more
The pace of appreciation in the US Dollar has most certainly been turning heads around the globe. The Buck continues to run hot and at multi-year highs against many currencies on account of a severe monetary policy divergence between the Fed and other central banks, and on account of what looks to be a better economic outlook in the US.
Wake-up call
- construction output
- retail sales
- rate checking
- NAB economists
- Commodities slide
- local data
- Inflation headache
- Dealers report
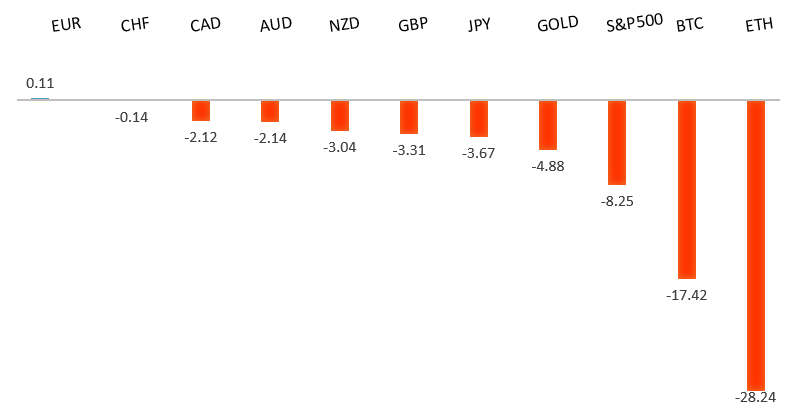
Peformance chart: 30 Day Performance vs. US dollar (%)
Suggested reading
- As Binary As It Gets: Bulls, Bears and the Pivot, J. Authers, Bloomberg (September 15, 2022)
- Queen Elizabeth II: Farewell to a Monarch, J. Han, Project Syndicate (September 16, 2022)
Chart talk: Technical & fundamental highlights
Choose pair:
EURUSD – technical overview
The market has come under intense pressure in recent months, with setbacks accelerating below the critical multi-year low from 2017 at 1.0340. This has set up a dip below monumental support in the form of parity. At the same time, technical studies are tracking in oversold territory, suggesting additional setbacks should be limited. Back above 1.0370 would be required to take the immediate pressure off the downside.EURUSD – fundamental overview
The Euro is still struggling mightily but did see some short-covering into the end of last week. There is a growing sense of the need for officials to be more mindful of the exchange rate, which could prompt action that inspires renewed demand. Key standouts on Monday’s calendar come from Eurozone construction output, ECB speak, Canada producer prices, and US NAHB housing.EURUSD - Technical charts in detail
GBPUSD – technical overview
The downtrend has been intense, with the market collapsing to a fresh multi-year low below what had been formidable support in the 1.1400 area. The next major barrier below comes in at 1.1000, though technical studies are severely extended, begging for some form of meaningful correction back to the topside. Back above 1.1739 takes the immediate pressure off the downside.GBPUSD – fundamental overview
The combination of an improved economic outlook in the US, sluggish UK economy, and clear policy divergence, have all weighed heavily on the Pound to multi-year lows against the Buck. Last Friday's awful UK retail sales print has only intensified GBP declines. Key standouts on Monday’s calendar come from Eurozone construction output, ECB speak, Canada producer prices, and US NAHB housing.USDJPY – technical overview
Technical studies are looking quite stretched on the longer-term chart, warning of consolidation and correction in the days and weeks ahead. Look for additional upside from here to be well capped into the 145.00 area. Next key support comes in at 140.25.USDJPY – fundamental overview
The massive monetary policy divergence between the Fed and BOJ continues to drive the direction in this market, though last week's reports of the BOJ checking rates has been enough to stop the Yen from additional declines. Still, the Japanese trade deficit has widened out sharply and many officials believe Japan lacks the ability to employ effective measures to stop the Yen decline. Key standouts on Monday’s calendar come from Eurozone construction output, ECB speak, Canada producer prices, and US NAHB housing.AUDUSD – technical overview
Overall pressure remains on the downside despite the recent recovery and conditions remain quite choppy. A break back above 0.7137 would be required to take the pressure off the downside. Until then, scope exists for a lower top below 0.7284 and deeper setbacks towards 0.6500.AUDUSD – fundamental overview
Risk off flow and downside pressure on commodities has been hurting the Australian Dollar, while this latest less hawkish talk out from RBA Lowe isn't doing much to help Aussie either. Last week, Lowe said the case for outsized interest-rate increases has 'diminished' now that the cash rate is approaching 'more normal settings,' reiterating the possibility of smaller moves ahead. NAB economists are however calling for a 50 basis point rate hike from the RBA at the next meeting, up from 25 basis points. Key standouts on Monday’s calendar come from Eurozone construction output, ECB speak, Canada producer prices, and US NAHB housing.USDCAD – technical overview
A recent surge back above 1.3000 signals an end to a period of bearish consolidation and suggests the market is in the process of carving out a more significant longer-term base. Next key resistance now comes in up into the 1.3500 area. Setbacks should be very well supported down into the 1.2500 area.USDCAD – fundamental overview
Commodities prices continued to get slammed, and Canada economic data has been quite soft of late. Meanwhile, we have yield differentials continuing to lean in the US Dollar's favor and a risk off mood that is all factoring into this drop in the Canadian Dollar to fresh yearly and multi-month lows. Key standouts on Monday’s calendar come from Eurozone construction output, ECB speak, Canada producer prices, and US NAHB housing.NZDUSD – technical overview
Overall pressure remains on the downside despite the recent recovery and conditions remain quite choppy. A break back above 0.6251 would be required to take the pressure off the downside. Until then, scope exists for deeper setbacks towards 0.5500.NZDUSD – fundamental overview
The risk correlated New Zealand Dollar has extended its run of multi-month lows, this on the back of the latest downturn in global sentiment in the aftermath of last week's hotter than expected US CPI print. Solid economic data out of New Zealand hasn't done much to help the currency's cause. Key standouts on Monday’s calendar come from Eurozone construction output, ECB speak, Canada producer prices, and US NAHB housing.US SPX 500 – technical overview
Longer-term technical studies are in the process of unwinding from extended readings off record highs. Look for rallies to be well capped in favor of lower tops and lower lows. Back above 4,328 will be required at a minimum to take the immediate pressure off the downside. Next major support comes in around 3,400.US SPX 500 – fundamental overview
We've finally reached a point in the cycle where the Fed recognizes unanchored inflation expectations pose a greater downside risk than over-tightening. This is significant, as it means less investor friendly monetary policy that risks potential recession in the months ahead. We have seen an attempt at recovery in recent weeks, with softer CPI reads helping. But overall, we expect inflation to continue to be a problem that results in renewed downside pressure into rallies.GOLD (SPOT) – technical overview
The 2019 breakout above the 2016 high at 1375 was a significant development, opening the door for fresh record highs. Setbacks should now be well supported above 1600 on a monthly close basis.GOLD (SPOT) – fundamental overview
The yellow metal continues to be well supported on dips with solid demand from medium and longer-term accounts. These players are more concerned about inflation risk and a less upbeat global growth outlook. All of this should keep the commodity well supported, with many market participants also fleeing to the hard asset as the grand dichotomy of record high equities and record low yields comes to an unnerving climax.