


Special report: FOMC decision preview
Today’s report: The Buck doesn't stop here
It seems the market has become even more unsettled in recent sessions, this on the realization that higher rates outside of the US are doing nothing to offset what has been a surge into US Dollars on what is still a yield differential that favors the Buck and on what is sure to also be flight to safety into the Dollar.
Wake-up call
- elevated inflation
- energy relief
- rate checking
- RBA Minutes
- Soft CPI
- macro flow
- Inflation headache
- Dealers report
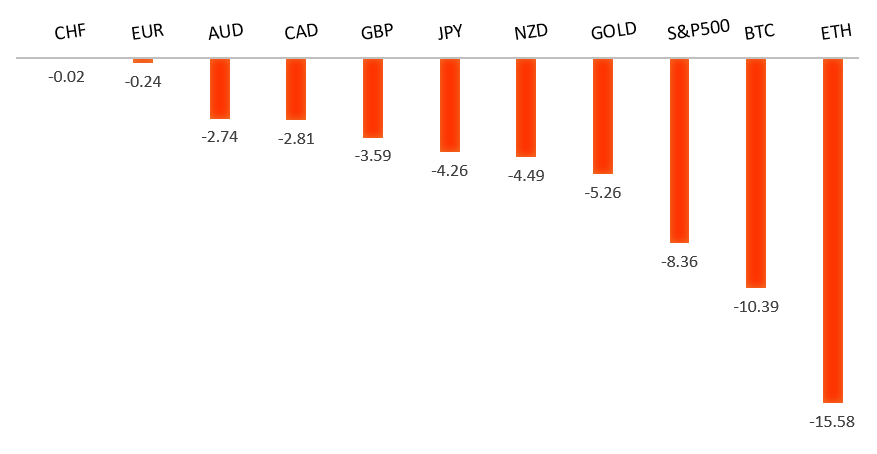
Peformance chart: 30 Day Performance vs. US dollar (%)
Suggested reading
- Four Big Market Things to Know That Aren’t the Fed, J. Authers, Bloomberg (September 21, 2022)
- The Rise and Rise of Buy Now, Pay Later, S. Venkataramakrishnan, Financial Times (September 20, 2022)
Chart talk: Technical & fundamental highlights
Choose pair:
EURUSD – technical overview
The market has come under intense pressure in recent months, with setbacks accelerating below the critical multi-year low from 2017 at 1.0340. This has set up a dip below monumental support in the form of parity. At the same time, technical studies are tracking in oversold territory, suggesting additional setbacks should be limited. Back above 1.0370 would be required to take the immediate pressure off the downside.EURUSD – fundamental overview
The shockingly elevated German producer prices print has only added to downside pressure on the Euro as it makes for a more uncomfortable outlook for the Eurozone economy. The combination of higher rates and an economy that won't be able to handle it, is not a pretty combination. The only other notable standout comes from US existing home sales.EURUSD - Technical charts in detail
GBPUSD – technical overview
The downtrend has been intense, with the market collapsing to a fresh multi-year low below what had been formidable support in the 1.1400 area. The next major barrier below comes in at 1.1000, though technical studies are severely extended, begging for some form of meaningful correction back to the topside. Back above 1.1739 takes the immediate pressure off the downside.GBPUSD – fundamental overview
The Pound continues to trade at multi-year lows with the currency unable to recover as it contends with worry about how the UK will finance energy relief programs. Yield differentials have been moving decidedly in the US Dollar's favor as well. The market will be looking for a 50 basis point rate hike from the BOE tomorrow, which will be followed up on Friday with the mini-budget. Today’s calendar is highlighted by the FOMC rate decision. There is no meaningful first-tier data on the docket in Europe. The only other notable standout comes from US existing home sales.USDJPY – technical overview
Technical studies are looking quite stretched on the longer-term chart, warning of consolidation and correction in the days and weeks ahead. Look for additional upside from here to be well capped into the 145.00 area. Next key support comes in at 140.25.USDJPY – fundamental overview
The massive monetary policy divergence between the Fed and BOJ continues to drive the direction in this market, though last week's reports of the BOJ checking rates has been enough to stop the Yen from additional declines. Still, the Japanese trade deficit has widened out sharply and many officials believe Japan lacks the ability to employ effective measures to stop the Yen decline. Today’s calendar is highlighted by the FOMC rate decision. There is no meaningful first-tier data on the docket in Europe. The only other notable standout comes from US existing home sales.AUDUSD – technical overview
Overall pressure remains on the downside despite the recent recovery and conditions remain quite choppy. A break back above 0.7137 would be required to take the pressure off the downside. Until then, scope exists for a lower top below 0.7284 and deeper setbacks towards 0.6500.AUDUSD – fundamental overview
Risk off flow has been hurting the Australian Dollar, while this latest less hawkish talk out from RBA isn't doing much to help Aussie either. Today’s calendar is highlighted by the FOMC rate decision. There is no meaningful first-tier data on the docket in Europe. The only other notable standout comes from US existing home sales.USDCAD – technical overview
A recent surge back above 1.3000 signals an end to a period of bearish consolidation and suggests the market is in the process of carving out a more significant longer-term base. Next key resistance now comes in up into the 1.3500 area. Setbacks should be very well supported down into the 1.2500 area.USDCAD – fundamental overview
Canada economic data has been quite soft of late including this latest Canada CPI miss. Meanwhile, we have yield differentials continuing to lean in the US Dollar's favor and a risk off mood, all factoring into this drop in the Canadian Dollar to fresh yearly and multi-month lows. Today’s calendar is highlighted by the FOMC rate decision. There is no meaningful first-tier data on the docket in Europe. The only other notable standout comes from US existing home sales.NZDUSD – technical overview
Overall pressure remains on the downside despite the recent recovery and conditions remain quite choppy. A break back above 0.6251 would be required to take the pressure off the downside. Until then, scope exists for deeper setbacks towards 0.5500.NZDUSD – fundamental overview
The risk correlated New Zealand Dollar has extended its run of multi-month lows, this on the back of the latest downturn in global sentiment in the aftermath of last week's hotter than expected US CPI print. Today’s calendar is highlighted by the FOMC rate decision. There is no meaningful first-tier data on the docket in Europe. The only other notable standout comes from US existing home sales.US SPX 500 – technical overview
Longer-term technical studies are in the process of unwinding from extended readings off record highs. Look for rallies to be well capped in favor of lower tops and lower lows. Back above 4,328 will be required at a minimum to take the immediate pressure off the downside. Next major support comes in around 3,400.US SPX 500 – fundamental overview
We've finally reached a point in the cycle where the Fed recognizes unanchored inflation expectations pose a greater downside risk than over-tightening. This is significant, as it means less investor friendly monetary policy that risks potential recession in the months ahead. We have seen an attempt at recovery in recent weeks, with softer CPI reads helping. But overall, we expect inflation to continue to be a problem that results in renewed downside pressure into rallies.GOLD (SPOT) – technical overview
The 2019 breakout above the 2016 high at 1375 was a significant development, opening the door for fresh record highs. Setbacks should now be well supported above 1600 on a monthly close basis.GOLD (SPOT) – fundamental overview
The yellow metal continues to be well supported on dips with solid demand from medium and longer-term accounts. These players are more concerned about inflation risk and a less upbeat global growth outlook. All of this should keep the commodity well supported, with many market participants also fleeing to the hard asset as the grand dichotomy of record high equities and record low yields comes to an unnerving climax.