


Next 24 hours: Mood sours in Thursday trade
Today’s report: Doubt creeping back in
The market has been trying as hard as it can to establish that inflation has in fact peaked. The problem is that we just can’t come to that conclusion at this stage, after one round of inflation reads out of the US.
Wake-up call
- ECB officials
- Autumn statement
- Japan data
- solid employment
- Poor timing
- Kiwi inflation
- Inflation headache
- Dealers report
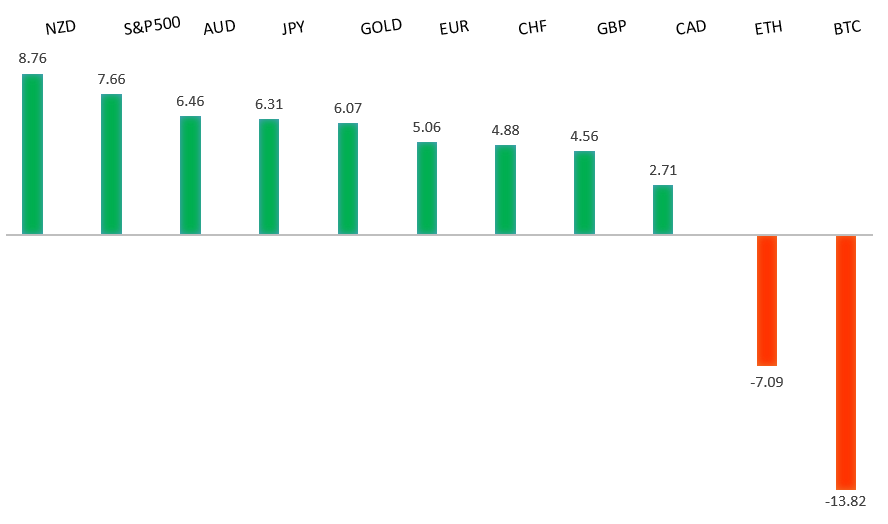
Peformance chart: 30 Day Performance vs. US dollar (%)
Suggested reading
- The ‘Next Warren Buffett’ Curse Isn’t Always Fatal, J. Fox, Bloomberg (November 17, 2022)
- Can Rapid Delivery Apps Get Back on Track?, S. O'Connor, Financial Times (November 14, 2022)
Chart talk: Technical & fundamental highlights
Choose pair:
EURUSD – technical overview
A break back above important resistance at 1.0200 suggests the market could be in the process of carving out a longer-term base after sinking to a multi-year low. Look for any setbacks to now be well supported ahead of 0.9900, with only a break back below 0.9730 to compromise the shifting outlook. Next key resistance comes in by previous support at 1.0636.EURUSD – fundamental overview
The latest batch of speak out from ECB officials has leaned more to the hawkish side, with members generally agreeing on the need for additional rate hikes. This has helped to keep the Euro propped up into the latter half of the week. Key standouts on Thursday’s calendar come from Eurozone inflation and construction output, the UK Autumn statement, and US reads in the form of housing starts, building permits, initial jobless claims, and the Philly Fed.EURUSD - Technical charts in detail
GBPUSD – technical overview
Signs have emerged of the market wanting to put in a longer-term base after collapsing to a record low in September. The latest weekly close back above the September high at 1.1739 strengthens this prospect. Any setbacks should now be well supported ahead of 1.1100. Next key resistance comes in at 1.2294.GBPUSD – fundamental overview
The Pound has been supported on higher BOE rate hike forecasts in the aftermath of another hot inflation read out of the UK. At the same time, gains have been capped on comments from BOE Bailey that pronounced inflation will ease up after the winter. Key standouts on Thursday’s calendar come from Eurozone inflation and construction output, the UK Autumn statement, and US reads in the form of housing starts, building permits, initial jobless claims, and the Philly Fed.USDJPY – technical overview
Longer-term technical studies are in the process of unwinding from severe overbought readings. Look for additional corrective price action back down towards the 130.00 area before the market considers the possibility of uptrend resumption. Rallies should now be well capped ahead of 147.00.USDJPY – fundamental overview
The Yen has been mostly sideways this week, getting hit on a soft batch of Japan data, but finding support on broad based US Dollar weakness from softer US inflation reads. Key standouts on Thursday’s calendar come from Eurozone inflation and construction output, the UK Autumn statement, and US reads in the form of housing starts, building permits, initial jobless claims, and the Philly Fed.AUDUSD – technical overview
There are signs of the potential formation of a longer-term base following the recent surge back above 0.6500. The latest weekly close back above previous support now turned resistance at 0.6682 strengthens the outlook for a bullish structural shift.AUDUSD – fundamental overview
The Australian Dollar has been more focused on macro flow and global sentiment than anything else right now. The currency has been sold after a nice run, even with Aussie employment data coming out better than expected. Key standouts on Thursday’s calendar come from Eurozone inflation and construction output, the UK Autumn statement, and US reads in the form of housing starts, building permits, initial jobless claims, and the Philly Fed.USDCAD – technical overview
A recent surge back above 1.3000 signals an end to a period of bearish consolidation and suggests the market is in the process of carving out a more significant longer-term base. Next key resistance now comes in up into the 1.4000 area. Setbacks should be very well supported down into the 1.3000 area.USDCAD – fundamental overview
Canada inflation data came in mostly as expected, though we did see a rise in all three core inflation measures. But the Canadian Dollar was sold on Wednesday given the poor timing of the Bank of Canada recently softening up on its policy stance. Key standouts on Thursday’s calendar come from Eurozone inflation and construction output, the UK Autumn statement, and US reads in the form of housing starts, building permits, initial jobless claims, and the Philly Fed.NZDUSD – technical overview
Overall pressure remains on the downside with risk for the current recovery rally to stall out and form a lower top for the next major downside extension. A break back above 0.6251 would be required to take the immediate pressure off the downside.NZDUSD – fundamental overview
New Zealand inflation data came in softer than most were expecting on Thursday and this along with a mild downturn in risk sentiment have invited some selling pressure on the New Zealand Dollar. Key standouts on Thursday’s calendar come from Eurozone inflation and construction output, the UK Autumn statement, and US reads in the form of housing starts, building permits, initial jobless claims, and the Philly Fed.US SPX 500 – technical overview
Longer-term technical studies are in the process of unwinding from extended readings off record highs. Look for rallies to be well capped in favor of lower tops and lower lows. A monthly close back above 4000 will be required at a minimum to take the immediate pressure off the downside. Next major support comes in around 3200.US SPX 500 – fundamental overview
We've finally reached a point in the cycle where the Fed recognizes unanchored inflation expectations pose a greater downside risk than over-tightening. This is significant, as it means less investor friendly monetary policy that risks potential recession in the months ahead. Overall, we expect inflation to continue to be a problem in Q4 2022 and Q1 2023 that results in downside pressure into rallies.GOLD (SPOT) – technical overview
The 2019 breakout above the 2016 high at 1375 was a significant development, opening the door for fresh record highs. Setbacks should now be well supported above 1600 on a monthly close basis ahead of the next major upside extension. Back above 1808 will strengthen the bullish outlook.GOLD (SPOT) – fundamental overview
The yellow metal continues to be well supported on dips with solid demand from medium and longer-term accounts. These players are more concerned about inflation risk and a less upbeat global growth outlook. All of this should keep the commodity well supported, with many market participants also fleeing to the hard asset as the grand dichotomy of record high equities and record low yields comes to an unnerving climax.