


Next 24 hours: Plenty of friendly distractions this week
Today’s report: Focus remains on Fed outlook
The market got a nice jolt from a recent run of softer US inflation data, but all of that momentum has faded away and we’re back to risk off, Dollar higher as the new week gets going.
Wake-up call
- recession risk
- stronger data
- Hot inflation
- China downturn
- Sluggish housing
- RBNZ expectations
- Inflation headache
- Dealers report
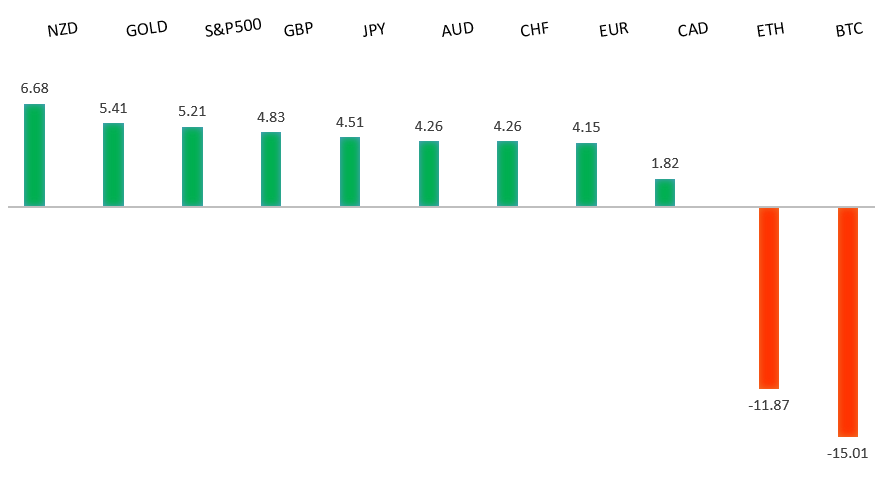
Peformance chart: 30 Day Performance vs. US dollar (%)
Suggested reading
- FTX Users Can’t Count on Help From the IRS, A. Leondis, Bloomberg (November 18, 2022)
- Manufacturing in America, Post-Globalisation, R. Foroohar, Financial Times (November 21, 2022)
Chart talk: Technical & fundamental highlights
Choose pair:
EURUSD – technical overview
A break back above important resistance at 1.0200 suggests the market could be in the process of carving out a longer-term base after sinking to a multi-year low. Look for any setbacks to now be well supported ahead of 0.9900, with only a break back below 0.9730 to compromise the shifting outlook. Next key resistance comes in by previous support at 1.0636.EURUSD – fundamental overview
The Euro has come back under pressure as the ECB warns of recession risk and ECB President Lagarde says overall risks have increased. Key standouts on Monday’s calendar come from German producer prices, a BOE Cunliffe speech, and the Chicago Fed National Activity Index.EURUSD - Technical charts in detail
GBPUSD – technical overview
Signs have emerged of the market wanting to put in a longer-term base after collapsing to a record low in September. The latest weekly close back above the September high at 1.1739 strengthens this prospect. Any setbacks should now be well supported ahead of 1.1100. Next key resistance comes in at 1.2294.GBPUSD – fundamental overview
The Pound has not been immune to setbacks from broad based Dollar demand, but has managed to outperform against some of its peers on the back of the latest batch of better than expected UK data including retail sales and consumer confidence. Key standouts on Monday’s calendar come from German producer prices, a BOE Cunliffe speech, and the Chicago Fed National Activity Index.USDJPY – technical overview
Longer-term technical studies are in the process of unwinding from severe overbought readings. Look for additional corrective price action back down towards the 130.00 area before the market considers the possibility of uptrend resumption. Rallies should now be well capped ahead of 147.00.USDJPY – fundamental overview
The Yen has held up relatively well in recent sessions, despite broad based US Dollar demand. The latest hotter than expected Japan inflation data is behind Yen demand, on the expectation it could force a shift of BOJ policy. Key standouts on Monday’s calendar come from German producer prices, a BOE Cunliffe speech, and the Chicago Fed National Activity Index.AUDUSD – technical overview
There are signs of the potential formation of a longer-term base following the recent surge back above 0.6500. The latest weekly close back above previous support now turned resistance at 0.6682 strengthens the outlook for a bullish structural shift.AUDUSD – fundamental overview
There's been plenty of attempts at optimism around the China reopening, though ultimately, there hasn't been enough traction to generate sustainable demand. China markets fell for the third consecutive day, which has weighed on the correlated Australian Dollar. Key standouts on Monday’s calendar come from German producer prices, a BOE Cunliffe speech, and the Chicago Fed National Activity Index.USDCAD – technical overview
A recent surge back above 1.3000 signals an end to a period of bearish consolidation and suggests the market is in the process of carving out a more significant longer-term base. Next key resistance now comes in up into the 1.4000 area. Setbacks should be very well supported down into the 1.3000 area.USDCAD – fundamental overview
Sluggish Canada housing data and lower oil prices have opened some relative weakness in the Canadian Dollar in recent sessions. Key standouts on Monday’s calendar come from German producer prices, a BOE Cunliffe speech, and the Chicago Fed National Activity Index.NZDUSD – technical overview
Overall pressure remains on the downside with risk for the current recovery rally to stall out and form a lower top for the next major downside extension. A break back above 0.6251 would be required to take the immediate pressure off the downside.NZDUSD – fundamental overview
Expectations that the RBNZ will hike this week and become the first major central bank in the current cycle to cross back above 4% on rates, has been behind some of the relative strength in the New Zealand Dollar. Key standouts on Monday’s calendar come from German producer prices, a BOE Cunliffe speech, and the Chicago Fed National Activity Index.US SPX 500 – technical overview
Longer-term technical studies are in the process of unwinding from extended readings off record highs. Look for rallies to be well capped in favor of lower tops and lower lows. A monthly close back above 4000 will be required at a minimum to take the immediate pressure off the downside. Next major support comes in around 3200.US SPX 500 – fundamental overview
We've finally reached a point in the cycle where the Fed recognizes unanchored inflation expectations pose a greater downside risk than over-tightening. This is significant, as it means less investor friendly monetary policy that risks potential recession in the months ahead. Overall, we expect inflation to continue to be a problem in Q4 2022 and Q1 2023 that results in downside pressure into rallies.GOLD (SPOT) – technical overview
The 2019 breakout above the 2016 high at 1375 was a significant development, opening the door for fresh record highs. Setbacks should now be well supported above 1600 on a monthly close basis ahead of the next major upside extension. Back above 1808 will strengthen the bullish outlook.GOLD (SPOT) – fundamental overview
The yellow metal continues to be well supported on dips with solid demand from medium and longer-term accounts. These players are more concerned about inflation risk and a less upbeat global growth outlook. All of this should keep the commodity well supported, with many market participants also fleeing to the hard asset as the grand dichotomy of record high equities and record low yields comes to an unnerving climax.