


Next 24 hours: Pound outperforms in otherwise quiet trade
Today’s report: The final full trading day of the week
It’s Tuesday and we’re already into the final full trading day of the week, with many US market participants already heading off the desk tomorrow ahead of the Thanksgiving holiday.
Wake-up call
- Dovish ECB
- public finances
- Downbeat Asia
- China outlook
- BoC pricing
- leaning hawkish
- Inflation headache
- Dealers report
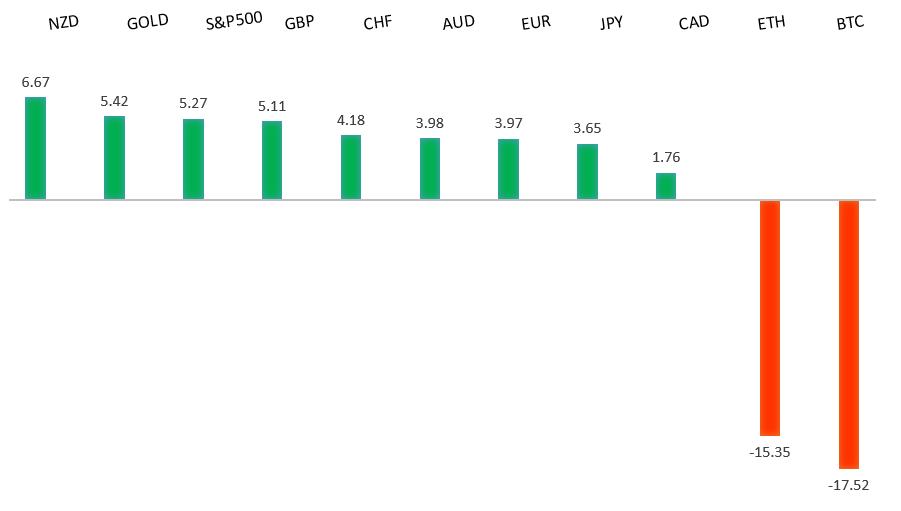
Peformance chart: 30 Day Performance vs. US dollar (%)
Suggested reading
- Will FTX-Like Unicorns Be the Next 'Big Short'?, C. Bryant, Bloomberg (November 21, 2022)
- Manufacturing in America, Post-Globalisation, R. Foroohar, Financial Times (November 21, 2022)
Chart talk: Technical & fundamental highlights
Choose pair:
EURUSD – technical overview
A break back above important resistance at 1.0200 suggests the market could be in the process of carving out a longer-term base after sinking to a multi-year low. Look for any setbacks to now be well supported ahead of 0.9900, with only a break back below 0.9730 to compromise the shifting outlook. Next key resistance comes in by previous support at 1.0636.EURUSD – fundamental overview
The Euro has rolled over in recent sessions on the back of dovish ECB speak and a pullback in German producer prices. ECB Lane was out suggesting the idea of a 75 basis point rate hike in December was off the table and that the platform for considering larger hikes was no longer there. Key standouts on Tuesday’s calendar come from UK public sector net borrowing, the Eurozone current account, Canada retail sales, Eurozone consumer confidence, the Richmond Fed index, and some Fed speak.EURUSD - Technical charts in detail
GBPUSD – technical overview
Signs have emerged of the market wanting to put in a longer-term base after collapsing to a record low in September. The latest weekly close back above the September high at 1.1739 strengthens this prospect. Any setbacks should now be well supported ahead of 1.1100. Next key resistance comes in at 1.2294.GBPUSD – fundamental overview
There hasn’t been much going on in the UK to account for recent weakness in the Pound. Lately, it’s been more about the resurgence in broad based US Dollar demand. Key standouts on Tuesday’s calendar come from UK public sector net borrowing, the Eurozone current account, Canada retail sales, Eurozone consumer confidence, the Richmond Fed index, and some Fed speak.USDJPY – technical overview
Longer-term technical studies are in the process of unwinding from severe overbought readings. Look for additional corrective price action back down towards the 130.00 area before the market considers the possibility of uptrend resumption. Rallies should now be well capped ahead of 147.00.USDJPY – fundamental overview
Most of the latest weakness in the Yen comes from a downbeat mood in the Asia Pacific region and setbacks in the RMB. We’ve also seen Yen selling on broad based US Dollar demand. Key standouts on Tuesday’s calendar come from UK public sector net borrowing, the Eurozone current account, Canada retail sales, Eurozone consumer confidence, the Richmond Fed index, and some Fed speak.AUDUSD – technical overview
There are signs of the potential formation of a longer-term base following the recent surge back above 0.6500. The latest weekly close back above previous support now turned resistance at 0.6682 strengthens the outlook for a bullish structural shift.AUDUSD – fundamental overview
A cloudy outlook in China has been a drag on the Australian Dollar this week. We’ve also seen setbacks on account of broad based US Dollar demand. Key standouts on Tuesday’s calendar come from UK public sector net borrowing, the Eurozone current account, Canada retail sales, Eurozone consumer confidence, the Richmond Fed index, and some Fed speak.USDCAD – technical overview
A recent surge back above 1.3000 signals an end to a period of bearish consolidation and suggests the market is in the process of carving out a more significant longer-term base. Next key resistance now comes in up into the 1.4000 area. Setbacks should be very well supported down into the 1.3000 area.USDCAD – fundamental overview
Slumping commodities prices in adjustments to Bank of Canada rate pricing have been behind a lot of the selloff in the Canadian Dollar in the early week. The local rate market is now pricing just a one in three chance for a 50-basis point rate hike next month. Key standouts on Tuesday’s calendar come from UK public sector net borrowing, the Eurozone current account, Canada retail sales, Eurozone consumer confidence, the Richmond Fed index, and some Fed speak.NZDUSD – technical overview
Overall pressure remains on the downside with risk for the current recovery rally to stall out and form a lower top for the next major downside extension. A break back above 0.6251 would be required to take the immediate pressure off the downside.NZDUSD – fundamental overview
While we have seen Kiwi weakness against the US Dollar in recent sessions, on account of a broad resurgence in US Dollar demand, the New Zealand Dollar has managed to outperform relative to its peers. A 75-basis point rate hike is expected tomorrow and the outlook for RBNZ policy continues to lean hawkish. Key standouts on Tuesday’s calendar come from UK public sector net borrowing, the Eurozone current account, Canada retail sales, Eurozone consumer confidence, the Richmond Fed index, and some Fed speak.US SPX 500 – technical overview
Longer-term technical studies are in the process of unwinding from extended readings off record highs. Look for rallies to be well capped in favor of lower tops and lower lows. A monthly close back above 4000 will be required at a minimum to take the immediate pressure off the downside. Next major support comes in around 3200.US SPX 500 – fundamental overview
We've finally reached a point in the cycle where the Fed recognizes unanchored inflation expectations pose a greater downside risk than over-tightening. This is significant, as it means less investor friendly monetary policy that risks potential recession in the months ahead. Overall, we expect inflation to continue to be a problem in Q4 2022 and Q1 2023 that results in downside pressure into rallies.GOLD (SPOT) – technical overview
The 2019 breakout above the 2016 high at 1375 was a significant development, opening the door for fresh record highs. Setbacks should now be well supported above 1600 on a monthly close basis ahead of the next major upside extension. Back above 1808 will strengthen the bullish outlook.GOLD (SPOT) – fundamental overview
The yellow metal continues to be well supported on dips with solid demand from medium and longer-term accounts. These players are more concerned about inflation risk and a less upbeat global growth outlook. All of this should keep the commodity well supported, with many market participants also fleeing to the hard asset as the grand dichotomy of record high equities and record low yields comes to an unnerving climax.