


Next 24 hours: Focus shifts to US core PCE
Today’s report: Investors hear what they want to hear
The market has responded with exuberance to the latest Fed Chair comments. The key focus has been on the part where Powell talked about a slowdown in the pace of rate hikes.
Wake-up call
- streak broken
- BOE Pill
- Japan data
- discouraging prints
- Oil bounce
- risk-on flow
- Inflation headache
- Dealers report
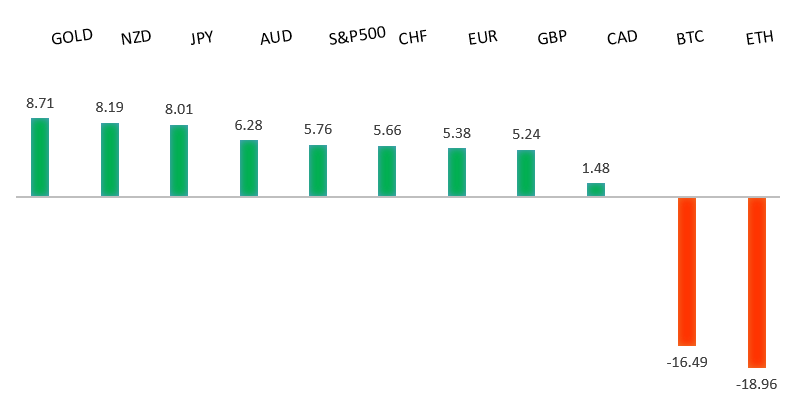
Peformance chart: 30 Day Performance vs. US dollar (%)
Suggested reading
- Rising Inventory Will Be the Housing Market’s Next Problem, J. Levin, Bloomberg (November 29, 2022)
- Why Did Carlyle’s CEO Resign?, A. Gara, Financial Times (November 28, 2022)
Chart talk: Technical & fundamental highlights
Choose pair:
EURUSD – technical overview
A break back above important resistance at 1.0200 suggests the market could be in the process of carving out a longer-term base after sinking to a multi-year low. Look for any setbacks to now be well supported ahead of 0.9900, with only a break back below 0.9730 to compromise the shifting outlook. Next key resistance comes in by previous support at 1.0636.EURUSD – fundamental overview
The Eurozone broke 16 months of higher CPI prints, which had some weighing influence on the rally, despite broad based currency demand on the back of risk on flow. Key standouts on Thursday’s calendar come from German retail sales, the ECB General Council Meeting, German, Eurozone, and UK manufacturing PMI reads, Eurozone unemployment, US personal income and spending, core PCE, initial jobless claims, ISM manufacturing, and construction spending.EURUSD - Technical charts in detail
GBPUSD – technical overview
Signs have emerged of the market wanting to put in a longer-term base after collapsing to a record low in September. The latest weekly close back above the September high at 1.1739 strengthens this prospect. Any setbacks should now be well supported ahead of 1.1100. Next key resistance comes in at 1.2294.GBPUSD – fundamental overview
BOE Pill was out saying the base case outlook did not include 5.25% rates, while claiming Brexit knocks 3% off trend growth over 15 years. Key standouts on Thursday’s calendar come from German retail sales, the ECB General Council Meeting, German, Eurozone, and UK manufacturing PMI reads, Eurozone unemployment, US personal income and spending, core PCE, initial jobless claims, ISM manufacturing, and construction spending.USDJPY – technical overview
Longer-term technical studies are in the process of unwinding from severe overbought readings. Look for additional corrective price action back down towards the 130.00 area before the market considers the possibility of uptrend resumption. Rallies should now be well capped ahead of 147.00.USDJPY – fundamental overview
The Yen has been better bid in recent sessions, getting a boost from the combination of hotter Japan inflation data and broad based US Dollar weakness. BOJ Board Member Asahi Noguchi was out saying monetary easing needs to be continued persistently to help improve a labor market that remains below its pre-pandemic level. Japan economic data came in soft, though this didn't factor into price action. Key standouts on Thursday’s calendar come from German retail sales, the ECB General Council Meeting, German, Eurozone, and UK manufacturing PMI reads, Eurozone unemployment, US personal income and spending, core PCE, initial jobless claims, ISM manufacturing, and construction spending.AUDUSD – technical overview
There are signs of the potential formation of a longer-term base following the recent surge back above 0.6500. The latest weekly close back above previous support now turned resistance at 0.6682 strengthens the outlook for a bullish structural shift.AUDUSD – fundamental overview
The Australian Dollar has shrugged off a poor round of economic data, instead focusing on the risk on flow, broad based US Dollar selling, and prospect of China reopening. Key standouts on Thursday’s calendar come from German retail sales, the ECB General Council Meeting, German, Eurozone, and UK manufacturing PMI reads, Eurozone unemployment, US personal income and spending, core PCE, initial jobless claims, ISM manufacturing, and construction spending.USDCAD – technical overview
A recent surge back above 1.3000 signals an end to a period of bearish consolidation and suggests the market is in the process of carving out a more significant longer-term base. Next key resistance now comes in up into the 1.4000 area. Setbacks should be very well supported down into the 1.3000 area.USDCAD – fundamental overview
The Canadian Dollar has been a standout underperformer in recent weeks, but did manage to put in an impressive recovery on Wednesday, getting help from an impressive bounce in the price of oil and risk on flow. Key standouts on Thursday’s calendar come from German retail sales, the ECB General Council Meeting, German, Eurozone, and UK manufacturing PMI reads, Eurozone unemployment, US personal income and spending, core PCE, initial jobless claims, ISM manufacturing, and construction spending.NZDUSD – technical overview
Overall pressure remains on the downside with risk for the current recovery rally to stall out and form a lower top for the next major downside extension. A break back above 0.6469 would be required to take the immediate pressure off the downside.NZDUSD – fundamental overview
Economic data out of New Zealand has not been great of late as highlighted by building approvals and business confidence reads. Nevertheless, the New Zealand Dollar has been able to shrug off these setbacks on account of broad based risk on flow and US Dollar selling. Key standouts on Thursday’s calendar come from German retail sales, the ECB General Council Meeting, German, Eurozone, and UK manufacturing PMI reads, Eurozone unemployment, US personal income and spending, core PCE, initial jobless claims, ISM manufacturing, and construction spending.US SPX 500 – technical overview
Longer-term technical studies are in the process of unwinding from extended readings off record highs. Look for rallies to be well capped in favor of lower tops and lower lows. A monthly close back above 4300 will be required at a minimum to take the immediate pressure off the downside. Next major support comes in at 3492.US SPX 500 – fundamental overview
We've finally reached a point in the cycle where the Fed recognizes unanchored inflation expectations pose a greater downside risk than over-tightening. This is significant, as it means less investor friendly monetary policy that risks potential recession in the months ahead. Overall, we expect inflation to continue to be a problem in Q4 2022 and Q1 2023 that results in downside pressure into rallies.GOLD (SPOT) – technical overview
The 2019 breakout above the 2016 high at 1375 was a significant development, opening the door for fresh record highs. Setbacks should now be well supported above 1600 on a monthly close basis ahead of the next major upside extension. Back above 1808 will strengthen the bullish outlook.GOLD (SPOT) – fundamental overview
The yellow metal continues to be well supported on dips with solid demand from medium and longer-term accounts. These players are more concerned about inflation risk and a less upbeat global growth outlook. All of this should keep the commodity well supported, with many market participants also fleeing to the hard asset as the grand dichotomy of record high equities and record low yields comes to an unnerving climax.