


Next 24 hours: Waiting to take cues from North American session
Today’s report: Fundamentals that simply can't be ignored
We had warned the market was pushing the peak inflation trade a little too much, especially after last Friday’s US jobs report, which produced upbeat NFPs and an above forecast hourly earnings.
Wake-up call
- economic data
- BOE Dhingra
- policy shift
- AUDUSD Inflation reads surge to record high
- building permits
- Commodities slump
- Inflation headache
- Dealers report
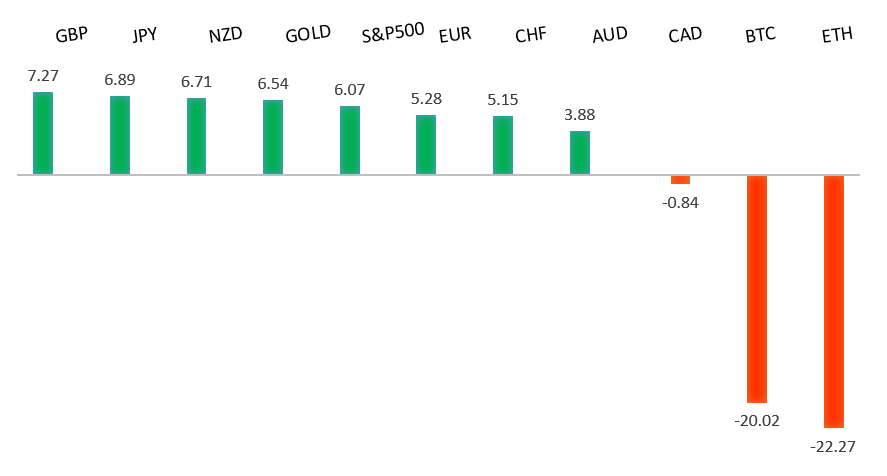
Peformance chart: 30 Day Performance vs. US dollar (%)
Suggested reading
- Did Much Happen While I Was Away?, J. Authers, Bloomberg (December 5, 2022)
- Has Big Oil Changed?, G. Bobillot, Financial Times (December 1, 2022)
Chart talk: Technical & fundamental highlights
Choose pair:
EURUSD – technical overview
A break back above important resistance at 1.0200 suggests the market could be in the process of carving out a longer-term base after sinking to a multi-year low. Look for any setbacks to now be well supported ahead of 0.9900, with only a break back below 0.9730 to compromise the shifting outlook. Next key resistance comes in by previous support at 1.0635.EURUSD – fundamental overview
The Euro came off with the rest of the currency market on Monday, though did manage to outperform as confidence and activity reports rebounded. Key standouts on Tuesday’s calendar come from German factory orders, Eurozone, German and UK construction PMIs, Canada trade, US trade, and Canada Ivey PMIs.EURUSD - Technical charts in detail
GBPUSD – technical overview
Signs have emerged of the market wanting to put in a longer-term base after collapsing to a record low in September. The latest weekly close back above the September high at 1.1739 strengthens this prospect. Any setbacks should now be well supported ahead of 1.1100. Next key resistance comes in at 1.2407.GBPUSD – fundamental overview
The Pound pulled back sharply on Monday, taking a hit on broad based US Dollar demand and dovish comments from BOE Dhingra who said rates should peak below 4.5%. Key standouts on Tuesday’s calendar come from German factory orders, Eurozone, German and UK construction PMIs, Canada trade, US trade, and Canada Ivey PMIs.USDJPY – technical overview
Longer-term technical studies are in the process of unwinding from severe overbought readings. Look for additional corrective price action back down towards the 130.00 area before the market considers the possibility of uptrend resumption. Rallies should now be well capped ahead of 140.00.USDJPY – fundamental overview
We saw some Yen weakness on Monday, mostly on broad based US Dollar gains. Overall however, the Yen has been better bid in recent sessions, getting a boost from the combination of hotter Japan inflation data and broad based US Dollar weakness. And last week, we saw reason for additional Yen upside after BOJ Tamura said it was getting close to conducting a policy assessment. Key standouts on Tuesday’s calendar come from German factory orders, Eurozone, German and UK construction PMIs, Canada trade, US trade, and Canada Ivey PMIs.AUDUSD – technical overview
There are signs of the potential formation of a longer-term base following the recent surge back above 0.6500. The latest weekly close back above previous support now turned resistance at 0.6682 strengthens the outlook for a bullish structural shift.AUDUSD – fundamental overview
The Australian Dollar fell victim to risk off flow and broad US Dollar gains, but did manage to find support as Aussie inflation reads surged to a record high. Melbourne Institute November inflation was up 1% m/m, while the y/y rate rose to 5.9%. Key standouts on Tuesday’s calendar come from German factory orders, Eurozone, German and UK construction PMIs, Canada trade, US trade, and Canada Ivey PMIs.USDCAD – technical overview
A recent surge back above 1.3000 signals an end to a period of bearish consolidation and suggests the market is in the process of carving out a more significant longer-term base. Next key resistance now comes in up into the 1.4000 area. Setbacks should be very well supported down into the 1.3000 area.USDCAD – fundamental overview
The Canadian Dollar has been a standout underperformer in recent weeks. Economic data has been soft overall and oil prices remain weighed down. Friday's discouraging Canada jobs report has been followed up by unimpressive building permits. Key standouts on Tuesday’s calendar come from German factory orders, Eurozone, German and UK construction PMIs, Canada trade, US trade, and Canada Ivey PMIs.NZDUSD – technical overview
Overall pressure remains on the downside with risk for the current recovery rally to stall out and form a lower top for the next major downside extension. A break back above 0.6469 would be required to take the immediate pressure off the downside.NZDUSD – fundamental overview
The New Zealand Dollar has held up well of late on more hawkish leaning RBNZ expectations, though could not avoid falling victim to Monday's commodities slump and risk off flow. New Zealand commodity export prices fell 3.9% m/m in November, down 11.5% y/y to their lowest since February 2021. Key standouts on Tuesday’s calendar come from German factory orders, Eurozone, German and UK construction PMIs, Canada trade, US trade, and Canada Ivey PMIs.US SPX 500 – technical overview
Longer-term technical studies are in the process of unwinding from extended readings off record highs. Look for rallies to be well capped in favor of lower tops and lower lows. A monthly close back above 4300 will be required at a minimum to take the immediate pressure off the downside. Next major support comes in at 3492.US SPX 500 – fundamental overview
We've finally reached a point in the cycle where the Fed recognizes unanchored inflation expectations pose a greater downside risk than over-tightening. This is significant, as it means less investor friendly monetary policy that risks potential recession in the months ahead. Overall, we expect inflation to continue to be a problem in Q4 2022 and Q1 2023 that results in downside pressure into rallies.GOLD (SPOT) – technical overview
The 2019 breakout above the 2016 high at 1375 was a significant development, opening the door for fresh record highs. Setbacks should now be well supported above 1600 on a monthly close basis ahead of the next major upside extension. This latest break back above 1808 strengthens the bullish outlook.GOLD (SPOT) – fundamental overview
The yellow metal continues to be well supported on dips with solid demand from medium and longer-term accounts. These players are more concerned about inflation risk and a less upbeat global growth outlook. All of this should keep the commodity well supported, with many market participants also fleeing to the hard asset as the grand dichotomy of record high equities and record low yields comes to an unnerving climax.