


Today’s report: Fed pivot trade gets another boost
The Fed pivot trade got another boost on Thursday, this after US CPI declined further in December. Traders are now fully embracing a 2023 Fed policy turnaround despite still higher core services inflation reads and strong employment numbers.
Wake-up call
- Revised outlook
- Big batch
- policy outlook
- trade surplus
- Commodities surge
- building permits
- Inflation headache
- Dealers report
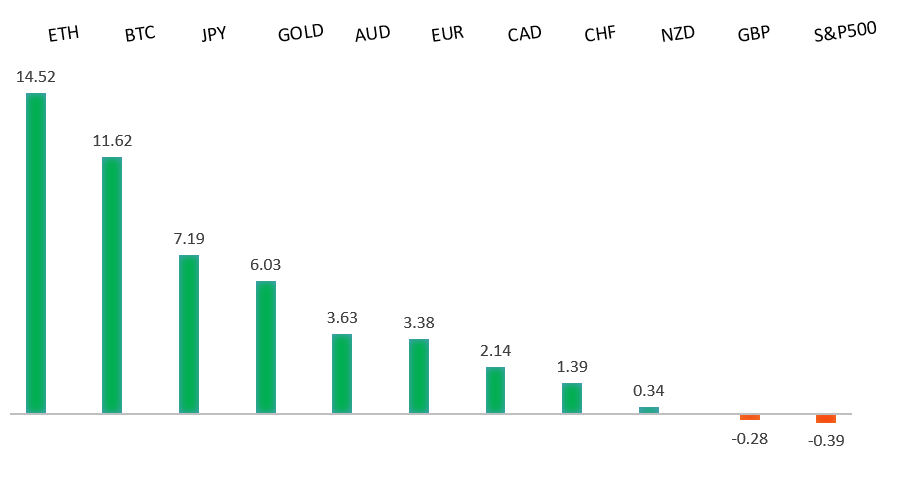
Peformance chart: 30 Day Performance vs. US dollar (%)
Suggested reading
- Where Will the Chinese Splash Their Extra $827 Billion?, S. Ren, Bloomberg (January 12, 2023)
- How Greed and Leverage Destroyed the Crypto Tulip Market, V. Katsenelson, Contrarian Edge (January 12, 2023)
Chart talk: Technical & fundamental highlights
Choose pair:
EURUSD – technical overview
The Euro recovery has finally run back above meaningful previous support turned resistance at 1.0635. The December close above this level further encourages the recovery outlook and makes a stronger case for the formation of a longer-term bottom. Any setbacks should now be well supported ahead of 1.0300. Next major resistance at 1.1000.EURUSD – fundamental overview
Many major banks were out this week upwardly revising their outlooks for the Eurozone economy. This has opened a wave of repositioning in favor of the Euro. Key standouts on Friday’s calendar come from UK GDP, industrial production, construction output and trade, Eurozone trade and industrial production, US import and export prices, and Michigan sentiment.EURUSD - Technical charts in detail
GBPUSD – technical overview
Signs have emerged of the market wanting to put in a longer-term base after collapsing to a record low in September. The latest weekly close back above the September high at 1.1739 strengthens this prospect. Any setbacks should now be well supported ahead of 1.1500. Next key resistance comes in at 1.2668.GBPUSD – fundamental overview
The Pound has made gains against the Buck, moving with the rest of the currency market. At the same time, GBP gains have been less impressive on a relative basis. Gilt yields dropped for the second consecutive day and the local market has been hobbled by all the strikes. Meanwhile UK online job ads have fallen below pre-COVID levels. Key standouts on Friday’s calendar come from UK GDP, industrial production, construction output and trade, Eurozone trade and industrial production, US import and export prices, and Michigan sentiment.USDJPY – technical overview
The major pair has been in the throes of a long overdue correction that was waiting to play out after a parabolic run to the topside to multi-year highs. At this stage, the correction could be getting close to having played out fully, with the market finally approaching critical previous resistance turned support in the 125.00 area.USDJPY – fundamental overview
The Yen has been exceptionally well bid of late on the back of broad US Dollar selling and chatter the BOJ will be reconsidering its policy outlook. Key standouts on Friday’s calendar come from UK GDP, industrial production, construction output and trade, Eurozone trade and industrial production, US import and export prices, and Michigan sentiment.AUDUSD – technical overview
There are signs of the potential formation of a longer-term base following the recent surge back above 0.6500. The recent weekly close back above previous support now turned resistance at 0.6682 strengthens the outlook for a bullish structural shift.AUDUSD – fundamental overview
The Australian Dollar has been feeling good as risk on vibes ramp up. Meanwhile, we've also seen Aussie demand from this weeks wider Aussie trade surplus result. Key standouts on Friday’s calendar come from UK GDP, industrial production, construction output and trade, Eurozone trade and industrial production, US import and export prices, and Michigan sentiment.USDCAD – technical overview
A recent surge back above 1.3000 signals an end to a period of bearish consolidation and suggests the market is in the process of carving out a more significant longer-term base. Next key resistance now comes in up into the 1.4000 area. Setbacks should be very well supported down into the 1.3000 area.USDCAD – fundamental overview
The Canadian Dollar has been better bid on broad based US Dollar weakness, commodities strength, and risk on flow. Key standouts on Friday’s calendar come from UK GDP, industrial production, construction output and trade, Eurozone trade and industrial production, US import and export prices, and Michigan sentiment.NZDUSD – technical overview
Overall pressure remains on the downside with risk for the current recovery rally to stall out and form a lower top for the next major downside extension. A break back above 0.6577 would be required to take the immediate pressure off the downside.NZDUSD – fundamental overview
Despite gains against the US Dollar in recent sessions, the Kiwi rate has underperformed against its peers on the back of a sharp decline in housing data, a soft commodities price index, and fresh doubts about just how much the RBNZ will need to shift to a less hawkish policy stance. We have however seen some renewed demand after New Zealand building permits rebounded. Key standouts on Friday’s calendar come from UK GDP, industrial production, construction output and trade, Eurozone trade and industrial production, US import and export prices, and Michigan sentiment.US SPX 500 – technical overview
Longer-term technical studies are in the process of unwinding from extended readings off record highs. Look for rallies to be well capped in favor of lower tops and lower lows. A monthly close back above 4300 will be required at a minimum to take the immediate pressure off the downside. Next major support comes in at 3492.US SPX 500 – fundamental overview
We've finally reached a point in the cycle where the Fed recognizes unanchored inflation expectations pose a greater downside risk than over-tightening. This is significant, as it means less investor friendly monetary policy that risks potential recession in the months ahead. Overall, we expect inflation to continue to be a problem in H1 2023 that results in downside pressure into rallies.GOLD (SPOT) – technical overview
The 2019 breakout above the 2016 high at 1375 was a significant development, opening the door for fresh record highs. Setbacks should now be well supported above 1600 on a monthly close basis ahead of the next major upside extension. The recent break back above 1808 strengthens the bullish outlook.GOLD (SPOT) – fundamental overview
The yellow metal continues to be well supported on dips with solid demand from medium and longer-term accounts. These players are more concerned about inflation risk and a less upbeat global growth outlook. All of this should keep the commodity well supported, with many market participants also fleeing to the hard asset as the grand dichotomy of record high equities and record low yields comes to an unnerving climax.