


Next 24 hours: Momentum fades into North America
Today’s report: Modest activity as the week gets going
Activity has been modest thus far in the early week. Holidays in the APAC region and a light economic calendar have contributed to this. Nevertheless, we have seen more demand for US equities and continued selling of the US Dollar.
Wake-up call
- Hawkish ECB
- public borrowing
- BOJ Minutes
- risk-on vibes
- manufacturing sales
- Ardern's successor
- Inflation headache
- Dealers report
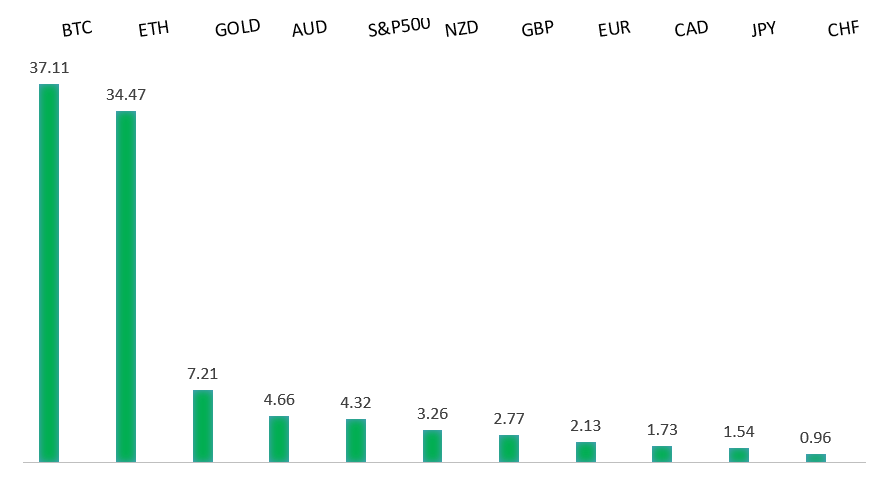
Peformance chart: 30 Day Performance vs. US dollar (%)
Suggested reading
- Wall Street Quants Shouldn't Confuse Luck With Skill, A. Brown, Bloomberg (January 23, 2023)
- Battling the Avian Flu Epidemic, A. Ahuja, Financial Times (January 24, 2023)
Chart talk: Technical & fundamental highlights
Choose pair:
EURUSD – technical overview
The Euro recovery has finally run back above meaningful previous support turned resistance at 1.0635. The December close above this level further encourages the recovery outlook and makes a stronger case for the formation of a longer-term bottom. Any setbacks should now be well supported ahead of 1.0300. Next major resistance at 1.1000.EURUSD – fundamental overview
The Euro extended gains to the highest level since April 2022, but the rally was short-lived above 1.0900. As far as the catalyst for the Euro demand goes, we continue to get hawkish communications out from ECB officials. Key standouts on Tuesday’s calendar come from German consumer confidence, UK public borrowing, German, Eurozone, and UK services and composite PMI reads, Canada manufacturing sales, US PMI reads, and the Richmond Fed Index.EURUSD - Technical charts in detail
GBPUSD – technical overview
Signs have emerged of the market wanting to put in a longer-term base after collapsing to a record low in September. The latest weekly close back above the September high at 1.1739 strengthens this prospect. Any setbacks should now be well supported ahead of 1.1500. Next key resistance comes in at 1.2668.GBPUSD – fundamental overview
Absence of first-tier economic data on Monday left the Pound trading on bigger picture themes. Overall, the Pound has been supported on broad based US Dollar outflows and risk on flow. Key standouts on Tuesday’s calendar come from German consumer confidence, UK public borrowing, German, Eurozone, and UK services and composite PMI reads, Canada manufacturing sales, US PMI reads, and the Richmond Fed Index.USDJPY – technical overview
The major pair has been in the throes of a long overdue correction that was waiting to play out after a parabolic run to the topside to multi-year highs. At this stage, the correction could be getting close to having played out fully, with the market finally approaching critical previous resistance turned support in the 125.00 area.USDJPY – fundamental overview
BOJ Minutes from December's meet showed government representatives had requested a first urgent time out since June 2021, suggesting they were surprised at planned adjustments to the YCC program. PM Kishida said it's too early to discuss revising an accord that aimed to help the BOJ achieve its 2% inflation goal. Key standouts on Tuesday’s calendar come from German consumer confidence, UK public borrowing, German, Eurozone, and UK services and composite PMI reads, Canada manufacturing sales, US PMI reads, and the Richmond Fed Index.AUDUSD – technical overview
There are signs of the potential formation of a longer-term base following the recent surge back above 0.6500. The recent weekly close back above previous support now turned resistance at 0.6682 strengthens the outlook for a bullish structural shift. Next key resistance comes in at 0.7137.AUDUSD – fundamental overview
The Australian Dollar has been well in demand on positive global market themes around the China reopening, risk on vibes, broad US Dollar selling, and a rally in commodities. Key standouts on Tuesday’s calendar come from German consumer confidence, UK public borrowing, German, Eurozone, and UK services and composite PMI reads, Canada manufacturing sales, US PMI reads, and the Richmond Fed Index.USDCAD – technical overview
A recent surge back above 1.3000 signals an end to a period of bearish consolidation and suggests the market is in the process of carving out a more significant longer-term base. Next key resistance now comes in up into the 1.4000 area. Setbacks should be very well supported down into the 1.3000 area.USDCAD – fundamental overview
The Canadian Dollar has been in demand in recent sessions on positive global market themes around the China reopening, risk on vibes, broad US Dollar selling, and a rally in commodities. Key standouts on Tuesday’s calendar come from German consumer confidence, UK public borrowing, German, Eurozone, and UK services and composite PMI reads, Canada manufacturing sales, US PMI reads, and the Richmond Fed Index.NZDUSD – technical overview
Overall pressure remains on the downside with risk for the current recovery rally to stall out and form a lower top for the next major downside extension. A break back above 0.6577 would be required to take the immediate pressure off the downside.NZDUSD – fundamental overview
Outgoing New Zealand PM Ardern's now confirmed successor, Chris Hipkins, pledged to prioritize the economy and food inflation, potentially removing some of his predecessor's policies ahead of an October election. Key standouts on Tuesday’s calendar come from German consumer confidence, UK public borrowing, German, Eurozone, and UK services and composite PMI reads, Canada manufacturing sales, US PMI reads, and the Richmond Fed Index.US SPX 500 – technical overview
Longer-term technical studies are in the process of unwinding from extended readings off record highs. Look for rallies to be well capped in favor of lower tops and lower lows. A monthly close back above 4300 will be required at a minimum to take the immediate pressure off the downside. Next major support comes in at 3492.US SPX 500 – fundamental overview
We've finally reached a point in the cycle where the Fed recognizes unanchored inflation expectations pose a greater downside risk than over-tightening. This is significant, as it means less investor friendly monetary policy that risks potential recession in the months ahead. Overall, we expect inflation to continue to be a problem in H1 2023 that results in downside pressure into rallies.GOLD (SPOT) – technical overview
The 2019 breakout above the 2016 high at 1375 was a significant development, opening the door for fresh record highs. Setbacks should now be well supported above 1600 on a monthly close basis ahead of the next major upside extension. The recent break back above 1808 strengthens the bullish outlook. Next major resistance comes in at 2000.GOLD (SPOT) – fundamental overview
The yellow metal continues to be well supported on dips with solid demand from medium and longer-term accounts. These players are more concerned about inflation risk and a less upbeat global growth outlook. All of this should keep the commodity well supported, with many market participants also fleeing to the hard asset as the grand dichotomy of record high equities and record low yields comes to an unnerving climax.