


Next 24 hours: Are we shifting back to worry mode?
Today’s report: Australian Dollar outperforms on hot inflation data
The market has been feeling a little better about global growth prospects. Nevertheless, this continues to run up against fears of recession from the impact of higher rates.
Wake-up call
- mixed bag
- concerning deficit
- PMI data
- hot inflation
- policy decision
- Kiwi inflation
- Inflation headache
- Dealers report
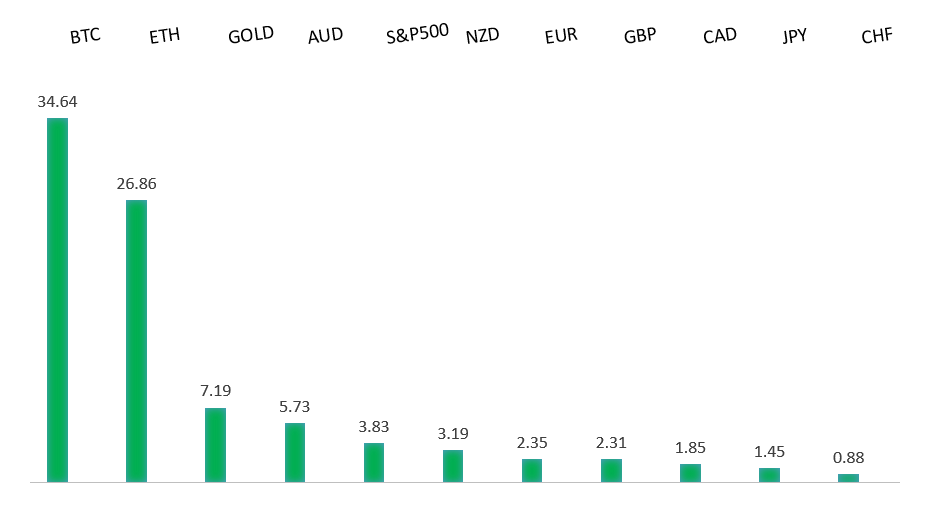
Peformance chart: 30 Day Performance vs. US dollar (%)
Suggested reading
- Dumb, Dumber and Leading Economic Indicators, J. Authers, Bloomberg (January 24, 2023)
- Battling the Avian Flu Epidemic, A. Ahuja, Financial Times (January 24, 2023)
Chart talk: Technical & fundamental highlights
Choose pair:
EURUSD – technical overview
The Euro recovery has finally run back above meaningful previous support turned resistance at 1.0635. The December close above this level further encourages the recovery outlook and makes a stronger case for the formation of a longer-term bottom. Any setbacks should now be well supported ahead of 1.0300. Next major resistance at 1.1000.EURUSD – fundamental overview
The latest batch of economic data out of the Eurozone came in mixed, though the Euro has been well supported on the hawkish ECB rhetoric. Key standouts on Wednesday’s calendar come from UK producer prices, German IFO reads, and the Bank of Canada policy decision.EURUSD - Technical charts in detail
GBPUSD – technical overview
Signs have emerged of the market wanting to put in a longer-term base after collapsing to a record low in September. The latest weekly close back above the September high at 1.1739 strengthens this prospect. Any setbacks should now be well supported ahead of 1.1500. Next key resistance comes in at 1.2668.GBPUSD – fundamental overview
The Pound had a difficult session on Tuesday after PMI reads came in soft and budget deficit numbers were horrendous. Key standouts on Wednesday’s calendar come from UK producer prices, German IFO reads, and the Bank of Canada policy decision.USDJPY – technical overview
The major pair has been in the throes of a long overdue correction that was waiting to play out after a parabolic run to the topside to multi-year highs. At this stage, the correction could be getting close to having played out fully, with the market finally approaching critical previous resistance turned support in the 125.00 area.USDJPY – fundamental overview
The Yen firmed up a bit on Tuesday after PMI data moved back into expansion territory. JGB yields were also up for a second straight day. Key standouts on Wednesday’s calendar come from UK producer prices, German IFO reads, and the Bank of Canada policy decision.AUDUSD – technical overview
There are signs of the potential formation of a longer-term base following the recent surge back above 0.6500. The recent weekly close back above previous support now turned resistance at 0.6682 strengthens the outlook for a bullish structural shift. Next key resistance comes in at 0.7137.AUDUSD – fundamental overview
The Australian Dollar is a very clear outperformer on this Wednesday, with the currency finding strong demand on the back of inflation data well above forecast. Key standouts on Wednesday’s calendar come from UK producer prices, German IFO reads, and the Bank of Canada policy decision.USDCAD – technical overview
A recent surge back above 1.3000 signals an end to a period of bearish consolidation and suggests the market is in the process of carving out a more significant longer-term base. Next key resistance now comes in up into the 1.4000 area. Setbacks should be very well supported down into the 1.3000 area.USDCAD – fundamental overview
Attention now turns to today's Bank of Canada event risk, with the central bank expected to raise rates by 25 basis points. All eyes will be on the rate outlook and accompanying communication. Key standouts on Wednesday’s calendar come from UK producer prices, German IFO reads, and the mentioned Bank of Canada policy decision.NZDUSD – technical overview
Overall pressure remains on the downside with risk for the current recovery rally to stall out and form a lower top for the next major downside extension. A break back above 0.6577 would be required to take the immediate pressure off the downside.NZDUSD – fundamental overview
New Zealand inflation reads came in above forecast overall which has propped Kiwi somewhat on Wednesday. At the same time, the actual print of 7.2% YoY (near 3 decade high) is lower than the 7.5% YoY projected by the RBNZ in its November Monetary Policy Statement, which suggests a less aggressive rate hike next month. Key standouts on Wednesday’s calendar come from UK producer prices, German IFO reads, and the Bank of Canada policy decision.US SPX 500 – technical overview
Longer-term technical studies are in the process of unwinding from extended readings off record highs. Look for rallies to be well capped in favor of lower tops and lower lows. A monthly close back above 4300 will be required at a minimum to take the immediate pressure off the downside. Next major support comes in at 3492.US SPX 500 – fundamental overview
We've finally reached a point in the cycle where the Fed recognizes unanchored inflation expectations pose a greater downside risk than over-tightening. This is significant, as it means less investor friendly monetary policy that risks potential recession in the months ahead. Overall, we expect inflation to continue to be a problem in H1 2023 that results in downside pressure into rallies.GOLD (SPOT) – technical overview
The 2019 breakout above the 2016 high at 1375 was a significant development, opening the door for fresh record highs. Setbacks should now be well supported above 1600 on a monthly close basis ahead of the next major upside extension. The recent break back above 1808 strengthens the bullish outlook. Next major resistance comes in at 2000.GOLD (SPOT) – fundamental overview
The yellow metal continues to be well supported on dips with solid demand from medium and longer-term accounts. These players are more concerned about inflation risk and a less upbeat global growth outlook. All of this should keep the commodity well supported, with many market participants also fleeing to the hard asset as the grand dichotomy of record high equities and record low yields comes to an unnerving climax.