


Next 24 hours: Euro holding up better than the rest
Today’s report: Things are coming to a head
We come into the new week with the market still trying to figure out if it has it all right with respect to bets the Fed will finally relent and ease up on what has been a more aggressive policy track of higher rates.
Wake-up call
- Softer data
- BOE expectations
- Tokyo CPI
- producer prices
- Oil weakness
- confidence reads
- Inflation headache
- Dealers report
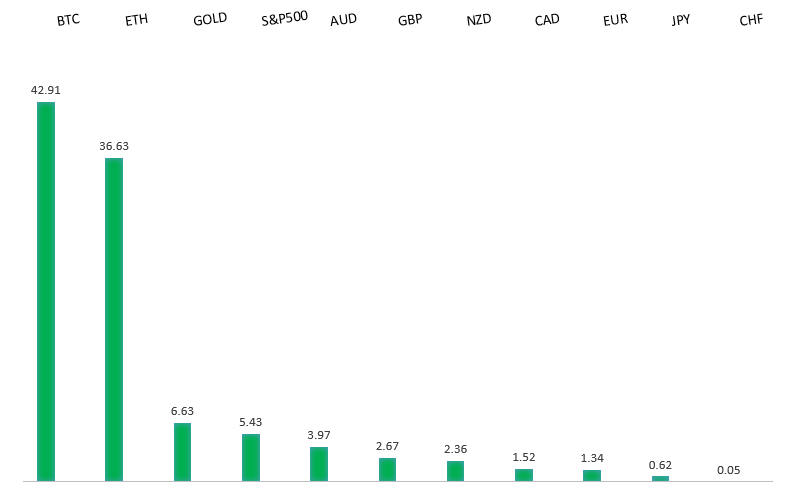
Peformance chart: 30 Day Performance vs. US dollar (%)
Suggested reading
- Crash Test This Week for Market Versus Real World, J. Authers, Bloomberg (January 30, 2023)
- US Dollar Smile: Mona Lisa or Joker?, L. Ashworth, FT Alphaville (January 26, 2023)
Chart talk: Technical & fundamental highlights
Choose pair:
EURUSD – technical overview
The Euro recovery has finally run back above meaningful previous support turned resistance at 1.0635. The December close above this level further encourages the recovery outlook and makes a stronger case for the formation of a longer-term bottom. Any setbacks should now be well supported ahead of 1.0300. Next major resistance at 1.1000.EURUSD – fundamental overview
The Euro came under pressure into the end of last week as tension around the Ukraine war ramped up. Not helping the single currency's cause was also a drop in Eurozone M3 growth and slumping French consumer confidence. Key standouts on Monday’s calendar come from German GDP, Eurozone confidence and sentiment reads, and Dallas Fed manufacturing.EURUSD - Technical charts in detail
GBPUSD – technical overview
Signs have emerged of the market wanting to put in a longer-term base after collapsing to a record low in September. The latest weekly close back above the September high at 1.1739 strengthens this prospect. Any setbacks should now be well supported ahead of 1.1500. Next key resistance comes in at 1.2668.GBPUSD – fundamental overview
The Pound held up well into the end of last week with most of the support coming from expectations around this week's BOE decision in which the market is looking for a 50 basis point hike from the central bank. Key standouts on Monday’s calendar come from German GDP, Eurozone confidence and sentiment reads, and Dallas Fed manufacturing.USDJPY – technical overview
The major pair has been in the throes of a long overdue correction that was waiting to play out after a parabolic run to the topside to multi-year highs. At this stage, the correction could be getting close to having played out fully, with the market finally approaching critical previous resistance turned support in the 125.00 area.USDJPY – fundamental overview
The Yen got a little boost into the end of last week after Tokyo CPI reads came in a good deal higher than forecast. All of this adds pressure on the BOJ to be taking the prospect of a shift in policy more seriously. Key standouts on Monday’s calendar come from German GDP, Eurozone confidence and sentiment reads, and Dallas Fed manufacturing.AUDUSD – technical overview
There are signs of the potential formation of a longer-term base following the recent surge back above 0.6500. The recent weekly close back above previous support now turned resistance at 0.6682 strengthens the outlook for a bullish structural shift. Next key resistance comes in at 0.7284.AUDUSD – fundamental overview
The most recent round of inflation data out of Australia, in the form of producer prices, has come in much softer than expected, which has opened downside pressure on the Australian Dollar as the market reconsiders hawkish RBA bets. Key standouts on Monday’s calendar come from German GDP, Eurozone confidence and sentiment reads, and Dallas Fed manufacturing.USDCAD – technical overview
A recent surge back above 1.3000 signals an end to a period of bearish consolidation and suggests the market is in the process of carving out a more significant longer-term base. Next key resistance now comes in up into the 1.4000 area. Setbacks should be very well supported down into the 1.3000 area.USDCAD – fundamental overview
The Canadian Dollar has been better bid of late on the back of last week's Bank of Canada rate hike and some better than expected Canada economic data. At the same time, the direction in the oil market will also play a role and weakness in recent sessions could be opening renewed selling in the Canadian Dollar. Key standouts on Monday’s calendar come from German GDP, Eurozone confidence and sentiment reads, and Dallas Fed manufacturing.NZDUSD – technical overview
Overall pressure remains on the downside with risk for the current recovery rally to stall out and form a lower top for the next major downside extension. A break back above 0.6577 would be required to take the immediate pressure off the downside.NZDUSD – fundamental overview
The New Zealand Dollar has been boosted by confidence surveys. Business confidence jumped and the activity outlook was also moving in the right direction. All of this has helped to keep the currency better bid of late. Key standouts on Monday’s calendar come from German GDP, Eurozone confidence and sentiment reads, and Dallas Fed manufacturing.US SPX 500 – technical overview
Longer-term technical studies are in the process of unwinding from extended readings off record highs. Look for rallies to be well capped in favor of lower tops and lower lows. A monthly close back above 4300 will be required at a minimum to take the immediate pressure off the downside. Next major support comes in at 3492.US SPX 500 – fundamental overview
We've finally reached a point in the cycle where the Fed recognizes unanchored inflation expectations pose a greater downside risk than over-tightening. This is significant, as it means less investor friendly monetary policy that risks potential recession in the months ahead. Overall, we expect inflation to continue to be a problem in H1 2023 that results in downside pressure into rallies.GOLD (SPOT) – technical overview
The 2019 breakout above the 2016 high at 1375 was a significant development, opening the door for fresh record highs. Setbacks should now be well supported above 1600 on a monthly close basis ahead of the next major upside extension. The recent break back above 1808 strengthens the bullish outlook. Next major resistance comes in at 2000.GOLD (SPOT) – fundamental overview
The yellow metal continues to be well supported on dips with solid demand from medium and longer-term accounts. These players are more concerned about inflation risk and a less upbeat global growth outlook. All of this should keep the commodity well supported, with many market participants also fleeing to the hard asset as the grand dichotomy of record high equities and record low yields comes to an unnerving climax.