


Special report: BOE and ECB decisions preview
Today’s report: The market sees what it wants to see
The market was clearly looking for any dovish communications at all to feel good about pushing stocks higher and selling the US Dollar. Despite the Fed going ahead with the as expected 25 basis point rate hike and saying that further policy tightening was required, the focus was elsewhere.
Wake-up call
- ECB meeting
- policy decision
- Yield differential
- building approvals
- Oil tumble
- building approvals
- Inflation headache
- Dealers report
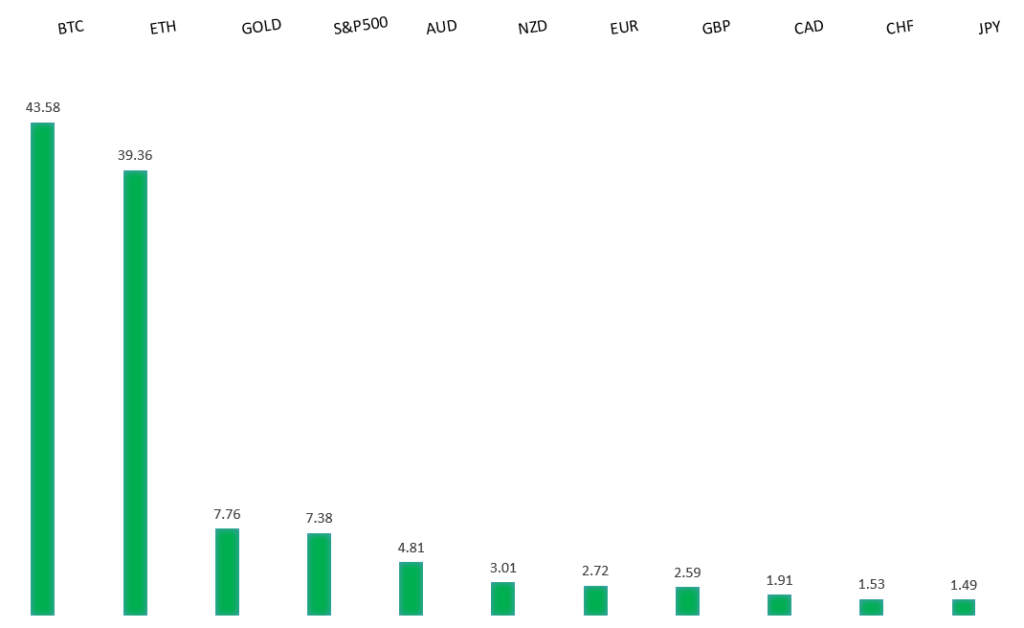
Peformance chart: 30 Day Performance vs. US dollar (%)
Suggested reading
- How Markets Deconstructed Powell, Then Lifted Off, J. Authers, Bloomberg (February 2, 2023)
- Capture, who's looking after the children?, N. Segal, FT (February 2, 2023)
Chart talk: Technical & fundamental highlights
Choose pair:
EURUSD – technical overview
The Euro recovery has finally run back above meaningful previous support turned resistance at 1.0635. The December 2022 close above this level further encourages the recovery outlook and makes a stronger case for the formation of a longer-term bottom. Any setbacks should now be well supported ahead of 1.0500. Next major resistance at 1.1185.EURUSD – fundamental overview
Wednesday was all about the Fed decision, with the market once again choosing to focus on the dovish aspects, which then opened additional broad based US Dollar weakness. Key standouts on Thursday’s calendar come from German trade, the BOE policy decision, the ECB policy decision, Canada building permits, US initial jobless claims, and US factory orders.EURUSD - Technical charts in detail
GBPUSD – technical overview
Signs have emerged of the market wanting to put in a longer-term base after collapsing to a record low in September. The latest weekly close back above the September high at 1.1739 strengthens this prospect. Any setbacks should now be well supported ahead of 1.1500. Next key resistance comes in at 1.2668.GBPUSD – fundamental overview
The Pound is focused on the upcoming BOE policy decision. The BOE is expected to deliver a 50bps rate hike to bring the bank rate from 3.5% to 4%. Markets are widely expecting the BOE will address the sticky core inflation, despite a moderation in the headline inflation. Eyes are also on a possible GDP forecast upgrade following improvement of market conditions. Key standouts on Thursday’s calendar come from German trade, the BOE policy decision, the ECB policy decision, Canada building permits, US initial jobless claims, and US factory orders.USDJPY – technical overview
The major pair has been in the throes of a long overdue correction that was waiting to play out after a parabolic run to the topside to multi-year highs. At this stage, the correction could be getting close to having played out fully, with the market finally approaching critical previous resistance turned support in the 125.00 area.USDJPY – fundamental overview
Broad based US Dollar selling in the aftermath of the latest Fed decision has factored into the latest round of Yen gains, with the currency benefitting from the yield differential shift. Key standouts on Thursday’s calendar come from German trade, the BOE policy decision, the ECB policy decision, Canada building permits, US initial jobless claims, and US factory orders.AUDUSD – technical overview
There are signs of the potential formation of a longer-term base following the recent surge back above 0.6500. The recent weekly close back above previous support now turned resistance at 0.6682 strengthens the outlook for a bullish structural shift. Next key resistance comes in at 0.7284.AUDUSD – fundamental overview
The Australian Dollar was already bid in the aftermath of the Fed decision. Then, Aussie building approvals rose by a much stronger-than-expected. For the RBA, this data point when combined with higher-than-expected Q4 CPI inflation should offset the impact of this week's weaker retail sales data, and a higher likelihood of a 25bp increase at the Feb 7 monetary policy meeting. Key standouts on Thursday’s calendar come from German trade, the BOE policy decision, the ECB policy decision, Canada building permits, US initial jobless claims, and US factory orders.USDCAD – technical overview
A recent surge back above 1.3000 signals an end to a period of bearish consolidation and suggests the market is in the process of carving out a more significant longer-term base. Next key resistance now comes in up into the 1.4000 area. Setbacks should be very well supported down into the 1.3000 area.USDCAD – fundamental overview
The Canadian Dollar has been bid up in the aftermath of broad based US Dollar selling from the Fed decision. At the same time, Wednesday's heavy setbacks in the price of oil has mitigated the extent of the Canadian Dollar rally. Key standouts on Thursday’s calendar come from German trade, the BOE policy decision, the ECB policy decision, Canada building permits, US initial jobless claims, and US factory orders.NZDUSD – technical overview
Overall pressure remains on the downside with risk for the current recovery rally to stall out and form a lower top for the next major downside extension. A break back above 0.6577 would be required to take the immediate pressure off the downside.NZDUSD – fundamental overview
The New Zealand Dollar has been bid up in the aftermath of broad based US Dollar selling from the Fed decision. At the same time, we have seen some selling into the rally after New Zealand building approvals data came in soft. Key standouts on Thursday’s calendar come from German trade, the BOE policy decision, the ECB policy decision, Canada building permits, US initial jobless claims, and US factory orders.US SPX 500 – technical overview
Longer-term technical studies are in the process of unwinding from extended readings off record highs. Look for rallies to be well capped in favor of lower tops and lower lows. A monthly close back above 4300 will be required at a minimum to take the immediate pressure off the downside. Next major support comes in at 3492.US SPX 500 – fundamental overview
We've finally reached a point in the cycle where the Fed recognizes unanchored inflation expectations pose a greater downside risk than over-tightening. This is significant, as it means less investor friendly monetary policy that risks potential recession in the months ahead. Overall, we expect inflation to continue to be a problem in H1 2023 that results in downside pressure into rallies.GOLD (SPOT) – technical overview
The 2019 breakout above the 2016 high at 1375 was a significant development, opening the door for fresh record highs. Setbacks should now be well supported above 1600 on a monthly close basis ahead of the next major upside extension. The recent break back above 1808 strengthens the bullish outlook. Next major resistance comes in at 2000.GOLD (SPOT) – fundamental overview
The yellow metal continues to be well supported on dips with solid demand from medium and longer-term accounts. These players are more concerned about inflation risk and a less upbeat global growth outlook. All of this should keep the commodity well supported, with many market participants also fleeing to the hard asset as the grand dichotomy of record high equities and record low yields comes to an unnerving climax.