


Next 24 hours: Lots of choppy up and down trade
Today’s report: Repricing Fed expectations
It’s been fairly quiet out there this week. A light economic calendar has definitely factored into this and we’re waiting to see where that next big wave of volatility comes from. At the moment, it’s been about the market coming to terms with a need to reprice Fed rate expectations.
Wake-up call
- ECB Guindos
- NIESR outlook
- JGB yields
- building permits
- BoC Macklem
- liquidity policy
- Inflation headache
- Dealers report
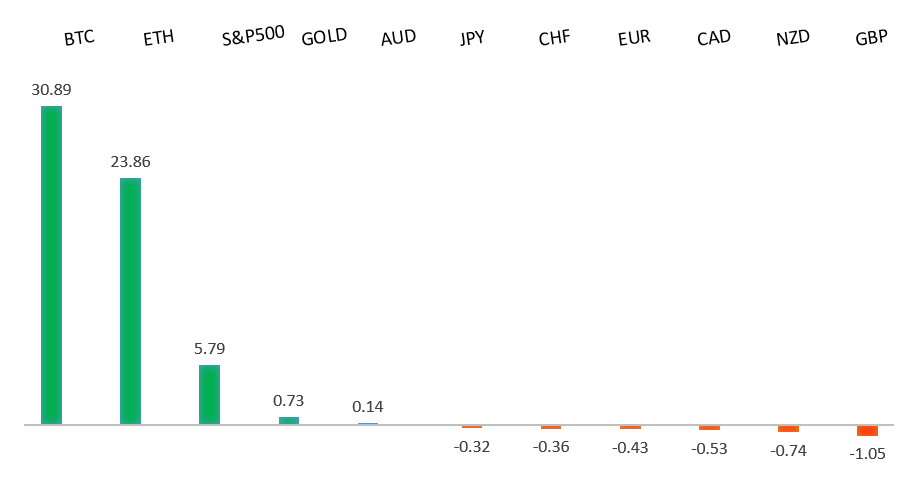
Peformance chart: 30 Day Performance vs. US dollar (%)
Suggested reading
- What Distressed Hedge Funds Want From Gautam Adani, S. Ren, Bloomberg (February 9, 2023)
- Fusion Power: How Close Are We?, S. Mundy, Financial Times (January 16, 2023)
Chart talk: Technical & fundamental highlights
Choose pair:
EURUSD – technical overview
The Euro recovery has finally run back above meaningful previous support turned resistance at 1.0635. The December 2022 close above this level further encourages the recovery outlook and makes a stronger case for the formation of a longer-term bottom. Any setbacks should now be well supported ahead of 1.0500. Next major resistance at 1.1185.EURUSD – fundamental overview
The Euro has been sideways in recent sessions. The only notable update comes from ECB Guindos who said the market may be too optimistic about expectations around inflation peaking. Key standouts on Thursday’s calendar come from German inflation, and US initial jobless claims.EURUSD - Technical charts in detail
GBPUSD – technical overview
Signs have emerged of the market wanting to put in a longer-term base after collapsing to a record low in September 2022. The recent weekly close back above the September high at 1.1739 strengthens this prospect. Any setbacks should now be well supported ahead of 1.1500. Next key resistance comes in at 1.2668.GBPUSD – fundamental overview
Think tank NIESR was out with calls for no UK recession in 2023, while local homebuilder Barratt was seeing an uptick in demand in January. These stories helped to prop the Pound. Key standouts on Thursday’s calendar come from German inflation, and US initial jobless claims.USDJPY – technical overview
The major pair has been in the throes of a long overdue correction that was waiting to play out after a parabolic run to the topside to multi-year highs. At this stage, the correction could be getting close to having played out fully, with the market finally approaching critical previous resistance turned support in the 125.00 area.USDJPY – fundamental overview
The Yen firmed up on Wednesday as JGB yields remained pinned to the policy ceiling. Key standouts on Thursday’s calendar come from German inflation, and US initial jobless claims.AUDUSD – technical overview
There are signs of the potential formation of a longer-term base following the recent surge back above 0.6500. The recent weekly close back above previous support now turned resistance at 0.6682 strengthens the outlook for a bullish structural shift. Next key resistance comes in at 0.7284.AUDUSD – fundamental overview
Aussie building permits came in as expected but up a great deal from previous, which may be factoring into some of the early Thursday Aussie demand. Key standouts on Thursday’s calendar come from German inflation, and US initial jobless claims.USDCAD – technical overview
A recent surge back above 1.3000 signals an end to a period of bearish consolidation and suggests the market is in the process of carving out a more significant longer-term base. Next key resistance now comes in up into the 1.4000 area. Setbacks should be very well supported down into the 1.3000 area.USDCAD – fundamental overview
Comments from Bank of Canada Macklem that the homeowner debt burden was what was behind the latest rate pause, were enough to force a round of selling in the Canadian Dollar on Wednesday. Key standouts on Thursday’s calendar come from German inflation, and US initial jobless claims.NZDUSD – technical overview
Overall pressure remains on the downside with risk for the current recovery rally to stall out and form a lower top for the next major downside extension. A break back above 0.6577 would be required to take the immediate pressure off the downside.NZDUSD – fundamental overview
The RBNZ reached the second phase of its review of liquidity policy, and is now seeking feedback on several significant issues. Issues included in the review are the eligibility criteria for liquid assets, the potential adoption of international standards, and tow liquidity requirements that could be applied across deposit takers in a proportionate manner. Key standouts on Thursday’s calendar come from German inflation, and US initial jobless claims.US SPX 500 – technical overview
Longer-term technical studies are in the process of unwinding from extended readings off record highs. Look for rallies to be well capped in favor of lower tops and lower lows. A monthly close back above 4300 will be required at a minimum to take the immediate pressure off the downside. Next major support comes in at 3492.US SPX 500 – fundamental overview
We've finally reached a point in the cycle where the Fed recognizes unanchored inflation expectations pose a greater downside risk than over-tightening. This is significant, as it means less investor friendly monetary policy that risks potential recession in the months ahead. Overall, we expect inflation to continue to be a problem in H1 2023 that results in downside pressure into rallies.GOLD (SPOT) – technical overview
The 2019 breakout above the 2016 high at 1375 was a significant development, opening the door for fresh record highs. Setbacks should now be well supported above 1600 on a monthly close basis ahead of the next major upside extension. The recent break back above 1808 strengthens the bullish outlook. Next major resistance comes in at 2000.GOLD (SPOT) – fundamental overview
The yellow metal continues to be well supported on dips with solid demand from medium and longer-term accounts. These players are more concerned about inflation risk and a less upbeat global growth outlook. All of this should keep the commodity well supported, with many market participants also fleeing to the hard asset as the grand dichotomy of record high equities and record low yields comes to an unnerving climax.