


Next 24 hours: Quiet start to the week
Today’s report: Odds for extended tightening cycle ramp up
The market has clearly been pricing in a more hawkish Fed of late, abandoning bets that once seemed a lot surer about a policy pivot. And another round of wide ranging data out of the US on Friday, has once again made this point, showing a stronger case for robust global growth and an extended tightening cycle.
Wake-up call
- ECB Vujcic
- dodges recession
- Ueda appointment
- Quarterly RBA
- Booming employment
- Lofty calls
- Inflation headache
- Dealers report
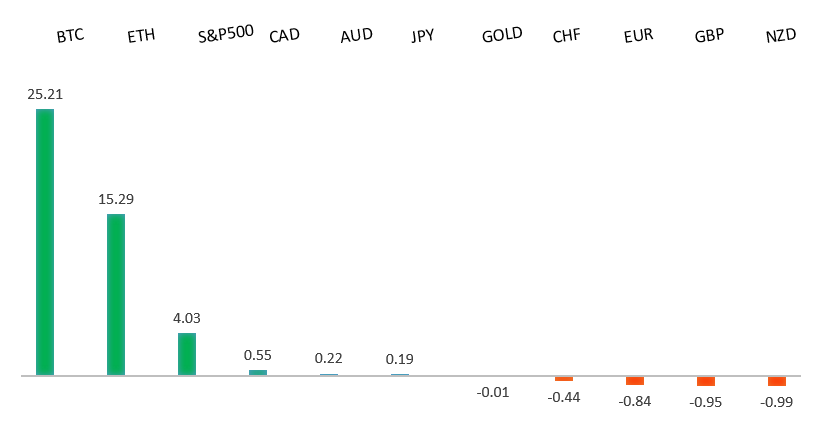
Peformance chart: 30 Day Performance vs. US dollar (%)
Suggested reading
- Safe as Houses Again, or the Next Big Crisis?, J. Authers, Bloomberg (February 10, 2023)
- As An Investor, Do You Suffer from Portfolio Prejudice?, S. McBride, Risk Hedge (February 8, 2023)
Chart talk: Technical & fundamental highlights
Choose pair:
EURUSD – technical overview
The Euro recovery has finally run back above meaningful previous support turned resistance at 1.0635. The December 2022 close above this level further encourages the recovery outlook and makes a stronger case for the formation of a longer-term bottom. Any setbacks should now be well supported ahead of 1.0500. Next major resistance at 1.1185.EURUSD – fundamental overview
We continued to hear hawkish speak out from ECB officials all through last week, with the latest coming from ECB Vujcic who sees rate hikes beyond March. But this wasn't enough to overcome a wave of broad based Dollar demand and technical selling in the Euro. Key standouts on Monday’s calendar come from a Fed Bowman speech and US consumer inflation expectations.EURUSD - Technical charts in detail
GBPUSD – technical overview
Signs have emerged of the market wanting to put in a longer-term base after collapsing to a record low in September 2022. The recent weekly close back above the September high at 1.1739 strengthens this prospect. Any setbacks should now be well supported ahead of 1.1500. Next key resistance comes in at 1.2668.GBPUSD – fundamental overview
The Pound tried to find some support on the news of the UK dodging a recession, this after GDP came in at 0.0% q/q, and 0.4% y/y. There were also attempts to support the currency better than expected UK industrial production and manufacturing production reads. But ultimately, a repricing of Fed bets was more the enough to offset this flow and keep the Pound under pressure into the weekly close. Key standouts on Monday’s calendar come from a Fed Bowman speech and US consumer inflation expectations.USDJPY – technical overview
The major pair has been in the throes of a long overdue correction that was waiting to play out after a parabolic run to the topside to multi-year highs. At this stage, the correction could be getting close to having played out fully, with the market finally approaching critical previous resistance turned support in the 125.00 area.USDJPY – fundamental overview
The Yen doesn't know what to make of the latest appointment of Kazuo Ueda as the next Governor of the BOJ. There was talk of Ueda leaning more hawkish based on the little reports that were out there. But ultimately, the market is going to need more time to figure out exactly where he stands. Key standouts on Monday’s calendar come from a Fed Bowman speech and US consumer inflation expectations.AUDUSD – technical overview
There are signs of the potential formation of a longer-term base following the recent surge back above 0.6500. The recent weekly close back above previous support now turned resistance at 0.6682 strengthens the outlook for a bullish structural shift. Next key resistance comes in at 0.7284.AUDUSD – fundamental overview
The Australian Dollar held up better than most of its peers into the end of last week, despite broad based US Dollar demand. The primary catalyst for the relative strength came from the quarterly RBA statement that tried to walk back on earlier communications about an upcoming pause to rate hikes. RBA Lowe said further rate increases were needed towards a 3.75% peak. Key standouts on Monday’s calendar come from a Fed Bowman speech and US consumer inflation expectations.USDCAD – technical overview
A recent surge back above 1.3000 signals an end to a period of bearish consolidation and suggests the market is in the process of carving out a more significant longer-term base. Next key resistance now comes in up into the 1.4000 area. Setbacks should be very well supported down into the 1.3000 area.USDCAD – fundamental overview
The Canadian Dollar was on fire to close out the previous week, outperforming across the board and getting a massive boost from a blowout Canada employment report that came in 10x better than expectation. A Bank of Canada rate pause is now no longer a sure thing, and the price action has reflected this shift in pricing. Key standouts on Monday’s calendar come from a Fed Bowman speech and US consumer inflation expectations.NZDUSD – technical overview
Overall pressure remains on the downside with risk for the current recovery rally to stall out and form a lower top for the next major downside extension. A break back above 0.6577 would be required to take the immediate pressure off the downside.NZDUSD – fundamental overview
The New Zealand Dollar lost ground on Friday, with the currency suffering from broad based risk off flow and US Dollar demand. At the same time, ANZ was out reiterating the base case for an RBNZ rate at 5.25%, but considering a scenario of 7%. Key standouts on Monday’s calendar come from a Fed Bowman speech and US consumer inflation expectations.US SPX 500 – technical overview
Longer-term technical studies are in the process of unwinding from extended readings off record highs. Look for rallies to be well capped in favor of lower tops and lower lows. A monthly close back above 4300 will be required at a minimum to take the immediate pressure off the downside. Next major support comes in at 3492.US SPX 500 – fundamental overview
We've finally reached a point in the cycle where the Fed recognizes unanchored inflation expectations pose a greater downside risk than over-tightening. This is significant, as it means less investor friendly monetary policy that risks potential recession in the months ahead. Overall, we expect inflation to continue to be a problem in H1 2023 that results in downside pressure into rallies.GOLD (SPOT) – technical overview
The 2019 breakout above the 2016 high at 1375 was a significant development, opening the door for fresh record highs. Setbacks should now be well supported above 1600 on a monthly close basis ahead of the next major upside extension. The recent break back above 1808 strengthens the bullish outlook. Next major resistance comes in at 2000.GOLD (SPOT) – fundamental overview
The yellow metal continues to be well supported on dips with solid demand from medium and longer-term accounts. These players are more concerned about inflation risk and a less upbeat global growth outlook. All of this should keep the commodity well supported, with many market participants also fleeing to the hard asset as the grand dichotomy of record high equities and record low yields comes to an unnerving climax.