


Special report: US CPI Preview
Today’s report: Yen under pressure as the week gets going
No major levels have been broken as the week gets going, and the price action is mostly just viewed as choppy consolidation. But what little price action we have seen has been risk on in nature, with stocks pushing higher and the US Dollar selling off.
Wake-up call
- EURUS Euro gets boost from EU Commission
- BOE Haskell
- Incoming Governor
- soft metals
- oil retreats
- food inflation
- Inflation headache
- Dealers report
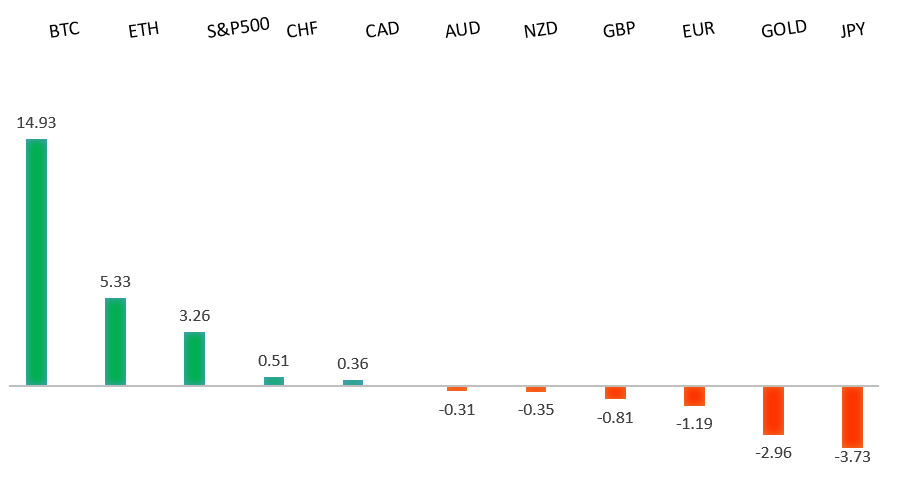
Peformance chart: 30 Day Performance vs. US dollar (%)
Suggested reading
- Uedanomics, or Japan Turns to a Mystery Sensei, J. Authers, Bloomberg (February 13, 2023)
- Recycling the World’s Hard Drive Waste, A. Gross, Financial Times (February 13, 2023)
Chart talk: Technical & fundamental highlights
Choose pair:
EURUSD – technical overview
The Euro recovery has finally run back above meaningful previous support turned resistance at 1.0635. The December 2022 close above this level further encourages the recovery outlook and makes a stronger case for the formation of a longer-term bottom. Any setbacks should now be well supported ahead of 1.0500. Next major resistance at 1.1185.EURUSD – fundamental overview
The Euro rebounded in Monday trade after the EU Commission upgraded the outlook, while presenting a rosy forecast. The Commission said it saw now recession, while upping 2023 GDP forecasts. Key standouts on Tuesday’s calendar come from German wholesale prices, UK employment data, Eurozone employment, and US CPI.EURUSD - Technical charts in detail
GBPUSD – technical overview
Signs have emerged of the market wanting to put in a longer-term base after collapsing to a record low in September 2022. The recent weekly close back above the September high at 1.1739 strengthens this prospect. Any setbacks should now be well supported ahead of 1.1500. Next key resistance comes in at 1.2668.GBPUSD – fundamental overview
The Pound has done well in recent sessions on the back of hawkish BOE comments. BOE Haskell was out saying the central bank needed to be really careful about inflation becoming embedded. Key standouts on Tuesday’s calendar come from German wholesale prices, UK employment data, Eurozone employment, and US CPI.USDJPY – technical overview
The major pair has been in the throes of a long overdue correction that was waiting to play out after a parabolic run to the topside to multi-year highs. At this stage, the correction could be getting close to having played out fully, with the market finally approaching critical previous resistance turned support in the 125.00 area.USDJPY – fundamental overview
The Yen sold off hard in Monday trade as more information was made available about the incoming BOJ Governor's views. Contrary to initial speculation, Ueda was reported to have described current policy as appropriate, adding that easing needed to continue. Key standouts on Tuesday’s calendar come from Japan GDP, German wholesale prices, UK employment data, Eurozone employment, and US CPI.AUDUSD – technical overview
There are signs of the potential formation of a longer-term base following the recent surge back above 0.6500. The recent weekly close back above previous support now turned resistance at 0.6682 strengthens the outlook for a bullish structural shift. Next key resistance comes in at 0.7284.AUDUSD – fundamental overview
Though we did see the Australian Dollar recover on Monday, the currency did lag against many of its peers as metals prices remained soft. Key standouts on Tuesday’s calendar come from German wholesale prices, UK employment data, Eurozone employment, and US CPI.USDCAD – technical overview
A recent surge back above 1.3000 signals an end to a period of bearish consolidation and suggests the market is in the process of carving out a more significant longer-term base. Next key resistance now comes in up into the 1.4000 area. Setbacks should be very well supported down into the 1.3000 area.USDCAD – fundamental overview
The Canadian Dollar wasn't able to keep up with other currencies making strong Monday gains against the Buck, and wasn't able to significantly extend the run from Friday's super impressive Canada employment report. It seems the market may have overreacted to the Canada jobs report just a bit, while softer commodities prices also factored into the less impressive Monday performance. Key standouts on Tuesday’s calendar come from German wholesale prices, UK employment data, Eurozone employment, and US CPI.NZDUSD – technical overview
Overall pressure remains on the downside with risk for the current recovery rally to stall out and form a lower top for the next major downside extension. A break back above 0.6577 would be required to take the immediate pressure off the downside.NZDUSD – fundamental overview
New Zealand food inflation data came in softer than expected early Tuesday, though this hasn't done anything to weigh on the currency. Instead, Kiwi gains are being driven off macro flow and the bigger picture uptick in sentiment. Key standouts on Tuesday’s calendar come from German wholesale prices, UK employment data, Eurozone employment, and US CPI.US SPX 500 – technical overview
Longer-term technical studies are in the process of unwinding from extended readings off record highs. Look for rallies to be well capped in favor of lower tops and lower lows. A monthly close back above 4300 will be required at a minimum to take the immediate pressure off the downside. Next major support comes in at 3492.US SPX 500 – fundamental overview
We've finally reached a point in the cycle where the Fed recognizes unanchored inflation expectations pose a greater downside risk than over-tightening. This is significant, as it means less investor friendly monetary policy that risks potential recession in the months ahead. Overall, we expect inflation to continue to be a problem in H1 2023 that results in downside pressure into rallies.GOLD (SPOT) – technical overview
The 2019 breakout above the 2016 high at 1375 was a significant development, opening the door for fresh record highs. Setbacks should now be well supported above 1600 on a monthly close basis ahead of the next major upside extension. The recent break back above 1808 strengthens the bullish outlook. Next major resistance comes in at 2000.GOLD (SPOT) – fundamental overview
The yellow metal continues to be well supported on dips with solid demand from medium and longer-term accounts. These players are more concerned about inflation risk and a less upbeat global growth outlook. All of this should keep the commodity well supported, with many market participants also fleeing to the hard asset as the grand dichotomy of record high equities and record low yields comes to an unnerving climax.