


Next 24 hours: Pound hit extra hard on soft inflation data
Today’s report: Market takes hit on hot US inflation reads
The market tried as hard as it could to hand onto the fact that headline CPI numbers out of the US were largely as expected. But ultimately, on the whole, the inflation data came in above forecast, with the services component running particularly hot at 7.2% to a fresh 40 year high.
Wake-up call
- EURUS Euro holds up on solid local data
- UK jobs
- Sakakibara
- macro forces
- Oil declines
- inflation expectations
- Inflation headache
- Dealers report
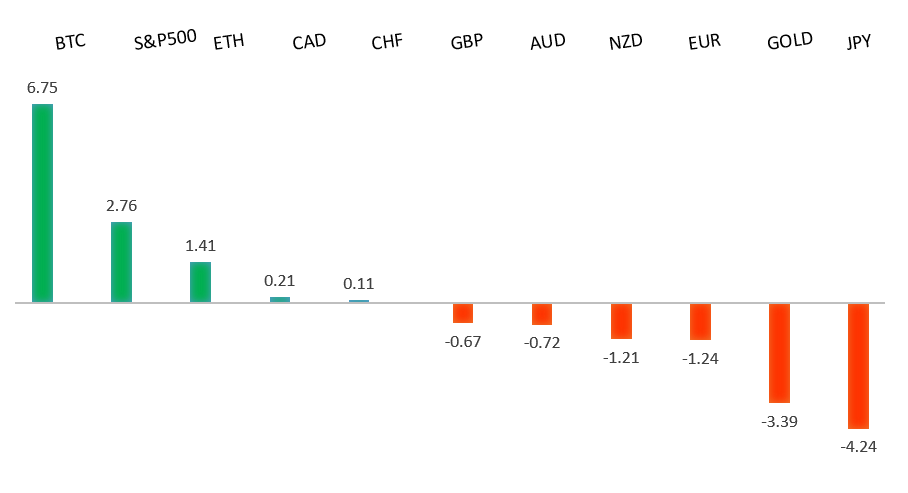
Peformance chart: 30 Day Performance vs. US dollar (%)
Suggested reading
- The Inflation Boogeyman Now Hides in Services, J. Authers, Bloomberg (February 15, 2023)
- Recycling the World’s Hard Drive Waste, A. Gross, Financial Times (February 13, 2023)
Chart talk: Technical & fundamental highlights
Choose pair:
EURUSD – technical overview
The Euro recovery has finally run back above meaningful previous support turned resistance at 1.0635. The December 2022 close above this level further encourages the recovery outlook and makes a stronger case for the formation of a longer-term bottom. Any setbacks should now be well supported ahead of 1.0500. Next major resistance at 1.1185.EURUSD – fundamental overview
Though the Euro came off from the Tuesday high on the back of a hotter than expected round of US inflation data, the currency held up rather well from its own solid round of data out of the Eurozone earlier in Tuesday trade. France unemployment ticked down, while Eurozone GDP avoided a negative print. Key standouts on Wednesday’s calendar come from UK inflation, Eurozone industrial production and trade, Canada housing starts, US retail sales, industrial production, business inventories, and NAHB housing.EURUSD - Technical charts in detail
GBPUSD – technical overview
Signs have emerged of the market wanting to put in a longer-term base after collapsing to a record low in September 2022. The recent weekly close back above the September high at 1.1739 strengthens this prospect. Any setbacks should now be well supported ahead of 1.1500. Next key resistance comes in at 1.2668.GBPUSD – fundamental overview
An impressive employment report out of the UK had the Pound outperforming in Tuesday trade, this despite a hotter round of US inflation data. UK payrolls were up big, while regular wage growth accelerated. Key standouts on Wednesday’s calendar come from UK inflation, Eurozone industrial production and trade, Canada housing starts, US retail sales, industrial production, business inventories, and NAHB housing.USDJPY – technical overview
The major pair has been in the throes of a long overdue correction that was waiting to play out after a parabolic run to the topside to multi-year highs. At this stage, the correction could be getting close to having played out fully, with the market finally approaching critical previous resistance turned support in the 125.00 area.USDJPY – fundamental overview
Yield differentials factored into Tuesday price action, with the Yen extending declines on the back of Dollar demand from a hot round of US inflation data. Still, there has been some Yen demand into dips, this on Former Vice Finance Minister Sakakibara comments, after the official said he sees a Japan rate hike in Q4. Key standouts on Wednesday’s calendar come from UK inflation, Eurozone industrial production and trade, Canada housing starts, US retail sales, industrial production, business inventories, and NAHB housing.AUDUSD – technical overview
There are signs of the potential formation of a longer-term base following the recent surge back above 0.6500. The recent weekly close back above previous support now turned resistance at 0.6682 strengthens the outlook for a bullish structural shift. Next key resistance comes in at 0.7284.AUDUSD – fundamental overview
The Australian Dollar has forgotten about a solid round of Aussie data in the form of business confidence and business conditions, coming under pressure on the hot US inflation data, downturn in stocks, and slide in commodities prices. Key standouts on Wednesday’s calendar come from UK inflation, Eurozone industrial production and trade, Canada housing starts, US retail sales, industrial production, business inventories, and NAHB housing.USDCAD – technical overview
A recent surge back above 1.3000 signals an end to a period of bearish consolidation and suggests the market is in the process of carving out a more significant longer-term base. Next key resistance now comes in up into the 1.4000 area. Setbacks should be very well supported down into the 1.3000 area.USDCAD – fundamental overview
US inflation data came in above forecast, US equities turned south, and oil prices dipped, all factoring into the latest round of weakness in the Canadian Dollar. Key standouts on Wednesday’s calendar come from UK inflation, Eurozone industrial production and trade, Canada housing starts, US retail sales, industrial production, business inventories, and NAHB housing.NZDUSD – technical overview
Overall pressure remains on the downside with risk for the current recovery rally to stall out and form a lower top for the next major downside extension. A break back above 0.6577 would be required to take the immediate pressure off the downside.NZDUSD – fundamental overview
The New Zealand Dollar was already hit with declining inflation expectations, before taking an added hit on the hot US inflation data, downturn in stocks, and slide in commodities prices. Key standouts on Wednesday’s calendar come from UK inflation, Eurozone industrial production and trade, Canada housing starts, US retail sales, industrial production, business inventories, and NAHB housing.US SPX 500 – technical overview
Longer-term technical studies are in the process of unwinding from extended readings off record highs. Look for rallies to be well capped in favor of lower tops and lower lows. A monthly close back above 4300 will be required at a minimum to take the immediate pressure off the downside. Next major support comes in at 3492.US SPX 500 – fundamental overview
We've finally reached a point in the cycle where the Fed recognizes unanchored inflation expectations pose a greater downside risk than over-tightening. This is significant, as it means less investor friendly monetary policy that risks potential recession in the months ahead. Overall, we expect inflation to continue to be a problem in H1 2023 that results in downside pressure into rallies.GOLD (SPOT) – technical overview
The 2019 breakout above the 2016 high at 1375 was a significant development, opening the door for fresh record highs. Setbacks should now be well supported above 1600 on a monthly close basis ahead of the next major upside extension. The recent break back above 1808 strengthens the bullish outlook. Next major resistance comes in at 2000.GOLD (SPOT) – fundamental overview
The yellow metal continues to be well supported on dips with solid demand from medium and longer-term accounts. These players are more concerned about inflation risk and a less upbeat global growth outlook. All of this should keep the commodity well supported, with many market participants also fleeing to the hard asset as the grand dichotomy of record high equities and record low yields comes to an unnerving climax.