


Next 24 hours: Hard to ignore those risk off vibes
Today’s report: Volatility to pick up as US market returns
We’re getting ready to get back to fuller trading conditions as the US market returns from the long weekend holiday. We didn’t see much price action at all on Monday and it makes sense the market is waiting for more clarity from US traders.
Wake-up call
- EURUS Euro recovers on hawkish comments
- retail sales
- bond buying
- RBA Minutes
- BoC Beaudry
- Cyclone Gabrielle
- Inflation headache
- Dealers report
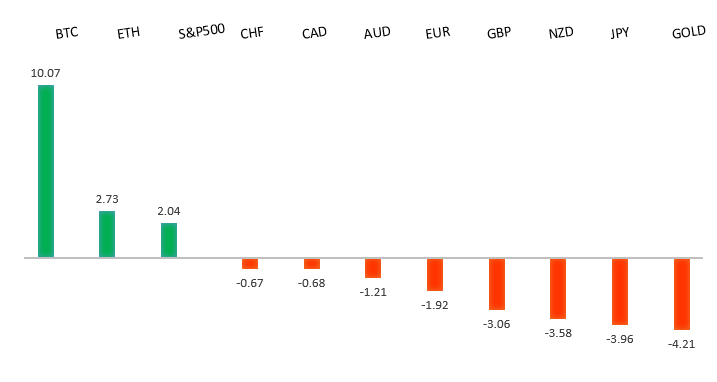
Peformance chart: 30 Day Performance vs. US dollar (%)
Suggested reading
- China’s Coal Mining Boom Is Running on Fumes, D. Fickling, Bloomberg (February 20, 2023)
- The Story Behind Jake Freeman’s Meme-Stock Bonanza, A. Gara, Financial Times (February 20, 2023)
Chart talk: Technical & fundamental highlights
Choose pair:
EURUSD – technical overview
The Euro recovery has finally run back above meaningful previous support turned resistance at 1.0635. The December 2022 close above this level further encourages the recovery outlook and makes a stronger case for the formation of a longer-term bottom. Any setbacks should now be well supported ahead of 1.0500. Next major resistance at 1.1185.EURUSD – fundamental overview
The Euro has recovered into the latest dip on the back of a wave of hawkish ECB comments. ECB Schnabel was one of these officials who said 'broad disinflation hadn't started and the transmission of policy may be weaker than in the past. Looking ahead, we get UK public borrowing, German and Eurozone PMI reads, UK PMI reads, Eurozone and German ZEWs, UK CBI trends, Canada inflation, US PMI reads, the New Zealand GDT auction, and US existing home sales.EURUSD - Technical charts in detail
GBPUSD – technical overview
Signs have emerged of the market wanting to put in a longer-term base after collapsing to a record low in September 2022. The recent weekly close back above the September high at 1.1739 strengthens this prospect. Any setbacks should now be well supported ahead of 1.1500. Next key resistance comes in at 1.2668.GBPUSD – fundamental overview
The Pound outperformed this past Friday on the back of a surprise UK retail sales beat. January retail sales rose 0.5% from -1.2% previous and -0.3% expected. Looking ahead, we get UK public borrowing, German and Eurozone PMI reads, UK PMI reads, Eurozone and German ZEWs, UK CBI trends, Canada inflation, US PMI reads, the New Zealand GDT auction, and US existing home sales.USDJPY – technical overview
The major pair has been in the throes of a long overdue correction that was waiting to play out after a parabolic run to the topside to multi-year highs. At this stage, the correction could be getting close to having played out fully, with the market finally approaching critical previous resistance turned support in the 125.00 area.USDJPY – fundamental overview
The Yen has extended declines as the BOJ continues with its bond buying operations and yield differentials move in the Buck's favor. Looking ahead, we get UK public borrowing, German and Eurozone PMI reads, UK PMI reads, Eurozone and German ZEWs, UK CBI trends, Canada inflation, US PMI reads, the New Zealand GDT auction, and US existing home sales.AUDUSD – technical overview
There are signs of the potential formation of a longer-term base following the recent surge back above 0.6500. The recent weekly close back above previous support now turned resistance at 0.6682 strengthens the outlook for a bullish structural shift. Next key resistance comes in at 0.7284.AUDUSD – fundamental overview
Last week's hawkish RBA Lowe comments were followed up with a hawkish leaning RBA Minutes earlier today. The Minutes left the door open to a more aggressive rate hiking path if inflation remains more persistent than the RBA expects, particularly in the context of tighter labor markets. Looking ahead, we get UK public borrowing, German and Eurozone PMI reads, UK PMI reads, Eurozone and German ZEWs, UK CBI trends, Canada inflation, US PMI reads, the New Zealand GDT auction, and US existing home sales.USDCAD – technical overview
A recent surge back above 1.3000 signals an end to a period of bearish consolidation and suggests the market is in the process of carving out a more significant longer-term base. Next key resistance now comes in up into the 1.4000 area. Setbacks should be very well supported down into the 1.3000 area.USDCAD – fundamental overview
The Canadian Dollar has been a laggard relative to most of its peers. The currency was under pressure into the weekly close, seemingly on the back of comments from Bank of Canada Beaudry who said it was ok for the central bank to pursue a slightly different path than other central banks to policy normalization. Looking ahead, we get UK public borrowing, German and Eurozone PMI reads, UK PMI reads, Eurozone and German ZEWs, UK CBI trends, Canada inflation, US PMI reads, the New Zealand GDT auction, and US existing home sales.NZDUSD – technical overview
Overall pressure remains on the downside with risk for the current recovery rally to stall out and form a lower top for the next major downside extension. A break back above 0.6577 would be required to take the immediate pressure off the downside.NZDUSD – fundamental overview
The New Zealand Treasury commented on the impact of Cyclone Gabrielle and other recent weather events, in a Fortnightly Economic Update published Tuesday. It is already clear that repairing damaged infrastructure and capital could take years; assessments are still being made as to the size of the rebuilding and recovery task. Demand associated with the recovery and rebuilding will support economic activity over coming years. “This additional demand in an already capacity-constrained economy will add to inflation pressure.” Looking ahead, we get UK public borrowing, German and Eurozone PMI reads, UK PMI reads, Eurozone and German ZEWs, UK CBI trends, Canada inflation, US PMI reads, the New Zealand GDT auction, and US existing home sales.US SPX 500 – technical overview
Longer-term technical studies are in the process of unwinding from extended readings off record highs. Look for rallies to be well capped in favor of lower tops and lower lows. A monthly close back above 4300 will be required at a minimum to take the immediate pressure off the downside. Next major support comes in at 3492.US SPX 500 – fundamental overview
We've finally reached a point in the cycle where the Fed recognizes unanchored inflation expectations pose a greater downside risk than over-tightening. This is significant, as it means less investor friendly monetary policy that risks potential recession in the months ahead. Overall, we expect inflation to continue to be a problem in H1 2023 that results in downside pressure into rallies.GOLD (SPOT) – technical overview
The 2019 breakout above the 2016 high at 1375 was a significant development, opening the door for fresh record highs. Setbacks should now be well supported above 1600 on a monthly close basis ahead of the next major upside extension. The recent break back above 1808 strengthens the bullish outlook. Next major resistance comes in at 2000.GOLD (SPOT) – fundamental overview
The yellow metal continues to be well supported on dips with solid demand from medium and longer-term accounts. These players are more concerned about inflation risk and a less upbeat global growth outlook. All of this should keep the commodity well supported, with many market participants also fleeing to the hard asset as the grand dichotomy of record high equities and record low yields comes to an unnerving climax.