


Next 24 hours: ECB Minutes, US initial jobless claims
Today’s report: Positive vibes hit the wall
Wednesday price action was a little messy. We saw early US Dollar weakness that wasn’t exactly accompanied by strength in US equities. And then we saw stocks eventually sell off, which ultimately opened the door for some recovery in the Buck.
Wake-up call
- ECB Nagel
- BOE Bailey
- policy outlook
- RBA direction
- higher oil
- trade data
- Inflation headache
- Dealers report
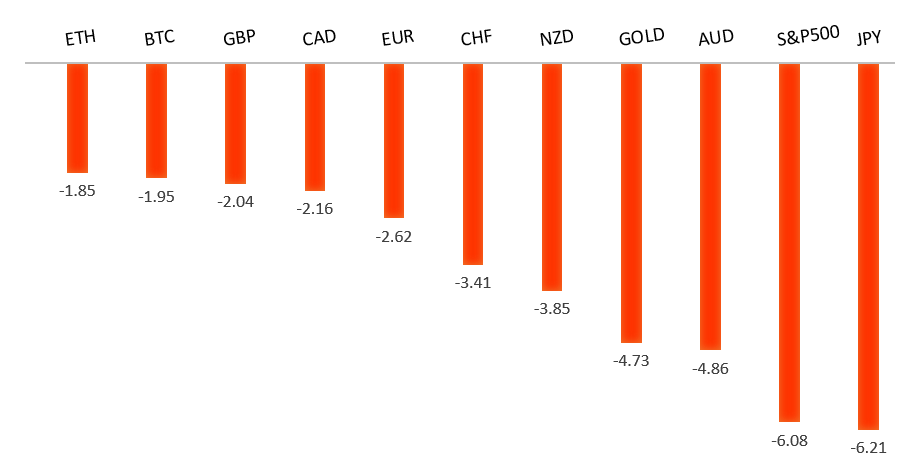
Peformance chart: 30 Day Performance vs. US dollar (%)
Suggested reading
- The Good and the Bad From the Factory Floor, J. Authers, Bloomberg (March 2, 2023)
- The Business of Formula 1, S. Agini, Financial Times (February 28, 2023)
Chart talk: Technical & fundamental highlights
Choose pair:
EURUSD – technical overview
The Euro is in the throes of a correction following a run to the topside through 1.1000 earlier this year. Any additional setbacks should be well supported ahead of 1.0200 in favor of the formation of the next major higher low and a bullish continuation. Ultimately, only a monthly close back below parity would give reason for concern.EURUSD – fundamental overview
The Euro has done a good job rallying back in recent sessions on hot German CPI reads and more hawkish commentary out from ECB officials. On Wednesday, ECB Nagel said significant hikes beyond March are necessary. Key standouts on Thursday’s calendar come from Eurozone inflation and unemployment, the ECB Minutes, and US initial jobless claims.EURUSD - Technical charts in detail
GBPUSD – technical overview
Signs have emerged of the market wanting to put in a longer-term base after collapsing to a record low in September 2022. The recent weekly close back above the September high at 1.1739 strengthens this prospect. Any setbacks should now be well supported ahead of 1.1500. Next key resistance comes in at 1.2668.GBPUSD – fundamental overview
The Pound fell off in Wednesday trade on dovish BOE comments. BOE Bailey was out saying nothing was decided with respect to the rate trajectory. The local UK money market sees 77 bps of tightening this year. Key standouts on Thursday’s calendar come from Eurozone inflation and unemployment, the ECB Minutes, and US initial jobless claims.USDJPY – technical overview
The major pair has been in the throes of a long overdue correction that was waiting to play out after a parabolic run to the topside to multi-year highs. At this stage, the correction could be getting close to having played out fully, with the market finally approaching critical previous resistance turned support in the 125.00 area.USDJPY – fundamental overview
The BOJ continues to signal a commitment to monetary policy accommodation, and the Yen remains under pressure as a consequence. BOJ Nakagawa was on the wires earlier saying the central bank needed to see the impact of the December policy tweak before making any fresh decision. Key standouts on Thursday’s calendar come from Eurozone inflation and unemployment, the ECB Minutes, and US initial jobless claims.AUDUSD – technical overview
There are signs of the potential formation of a longer-term base following the recent surge back above 0.6500. The recent weekly close back above previous support now turned resistance at 0.6682 strengthens the outlook for a bullish structural shift. Next key resistance comes in at 0.7284. Setbacks should be well supported ahead of 0.6500.AUDUSD – fundamental overview
The Australian Dollar has been underperforming on the back of the latest round of soft economic data highlighted by GDP, CPI misses and this latest weak residential property update. This has placed the conversation around an RBA pause back front and center. Key standouts on Thursday’s calendar come from Eurozone inflation and unemployment, the ECB Minutes, and US initial jobless claims.USDCAD – technical overview
A recent surge back above 1.3000 signals an end to a period of bearish consolidation and suggests the market is in the process of carving out a more significant longer-term base. Next key resistance now comes in up into the 1.4000 area. Setbacks should be very well supported down into the 1.3000 area.USDCAD – fundamental overview
The Canadian Dollar managed to put in a decent recovery on Wednesday, getting help from stronger PMI data and higher oil prices. Key standouts on Thursday’s calendar come from Eurozone inflation and unemployment, the ECB Minutes, and US initial jobless claims.NZDUSD – technical overview
Overall pressure remains on the downside with risk for the current recovery rally to stall out and form a lower top for the next major downside extension. A break back above 0.6577 would be required to take the immediate pressure off the downside.NZDUSD – fundamental overview
Earlier today, New Zealand terms of trade data came in solid. This follows a healthy Tuesday building permits read and the New Zealand Dollar has managed to hold up well as a consequence. Key standouts on Thursday’s calendar come from Eurozone inflation and unemployment, the ECB Minutes, and US initial jobless claims.US SPX 500 – technical overview
Longer-term technical studies are in the process of unwinding from extended readings off record highs. Look for rallies to be well capped in favor of lower tops and lower lows. A monthly close back above 4300 will be required at a minimum to take the immediate pressure off the downside. Next major support comes in at 3885.US SPX 500 – fundamental overview
We've finally reached a point in the cycle where the Fed recognizes unanchored inflation expectations pose a greater downside risk than over-tightening. This is significant, as it means less investor friendly monetary policy that risks potential recession in the months ahead. Overall, we expect inflation to continue to be a problem in H1 2023 that results in downside pressure into rallies.GOLD (SPOT) – technical overview
The 2019 breakout above the 2016 high at 1375 was a significant development, opening the door for fresh record highs. Setbacks should now be well supported above 1600 on a monthly close basis ahead of the next major upside extension. The recent break back above 1808 strengthens the bullish outlook. Next major resistance comes in at 2000.GOLD (SPOT) – fundamental overview
The yellow metal continues to be well supported on dips with solid demand from medium and longer-term accounts. These players are more concerned about inflation risk and a less upbeat global growth outlook. All of this should keep the commodity well supported, with many market participants also fleeing to the hard asset as the grand dichotomy of record high equities and record low yields comes to an unnerving climax.